- EOS bulls are keen on keeping the price above the 23.6% Fib support.
- Demand for EOS is likely to increase following a buy signal presented on the daily chart.
EOS has corrected significantly from the highs reached in August, losing at least 39% from a price level of $3.9. A recently established support at $2.2 allowed some semblance of stability to return to the market. EOS bulls are currently focused on a recovery mission aiming for $2.8 and $3.8, respectively.
EOS nears a market bottom
The TD Sequential indicator has presented a buy signal on the daily chart. The signal developed in the form of a red nine candlestick, which points towards a potential spike as long as the crucial support at $2.2 holds firmly. In case buying pressure increases significantly, EOS might start to establish a long-term uptrend.
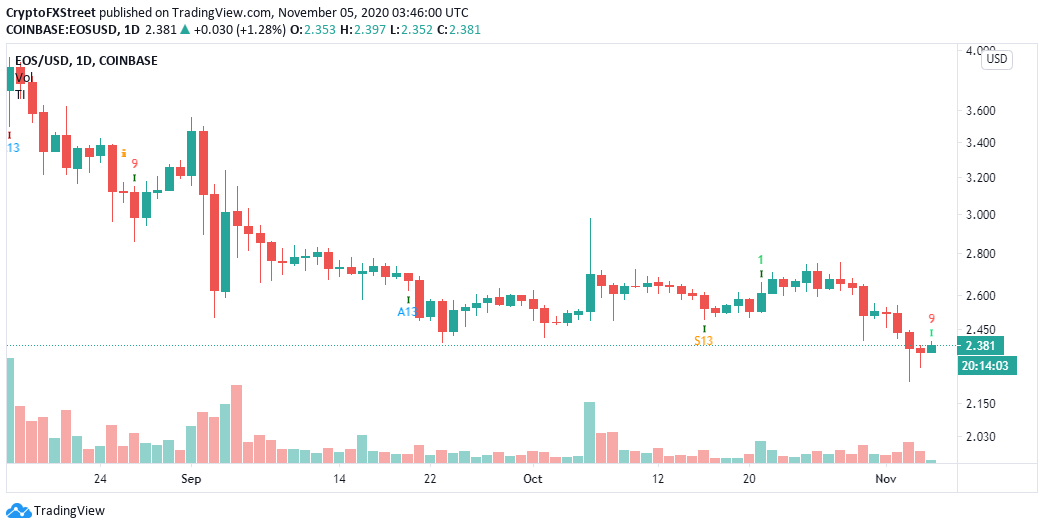
EOS/USD 1-day chart
The buy signal comes at crucial support when Fibonacci levels are considered from the highs in February to the lows in March. If EOS bounces off this support, we may see the prices rising to the 61.8% Fibonacci, as highlighted at $3.8.
-637401471205952258.png)
EOS/USD 3-day chart
It is worth mentioning that EOS must close above the 23.6% Fibonacci for the bullish narrative to hold. Moreover, the 50-day Simple Moving Average (SMA) might absorb some of the selling pressure, delaying the recovery. The 200 SMA and the 100 SMA are also in line to hinder the price movement. Therefore, bulls must brace themselves to fight for the ground above $3.0.
-637401470958904272.png)
EOS/USD 1-day chart
On the other hand, if EOS fails to hold above crucial support (23.6% Fib), the buy signal will be invalidated. A reversal below the prevailing price level might extend to the immediate support at $2.2. Consequently, the breakdown may extend towards March lows of $1.42.
