- EOS price had a massive 43% breakout in the past week reaching $3.77.
- The digital asset is still down 31% from its 2020-high set in February.
EOS has traded relatively flat in November despite the entire crypto market turning bullish. Finally, EOS price woke up, jumping from a low of $2.63 on November 20 to a current peak at $3.77. Unfortunately, some indicators are showing that the digital asset is poised for a pullback in the short-term.
EOS facing a potential massive correction
On the daily chart, the TD Sequential indicator has just presented a sell signal – in the form of a green nine candle – after EOS price reached $3.77. The same call was created on February 12, right at the 2020-high at $5.499. Considering the fast rally seen in the past week, there is very little support on the way down for EOS.
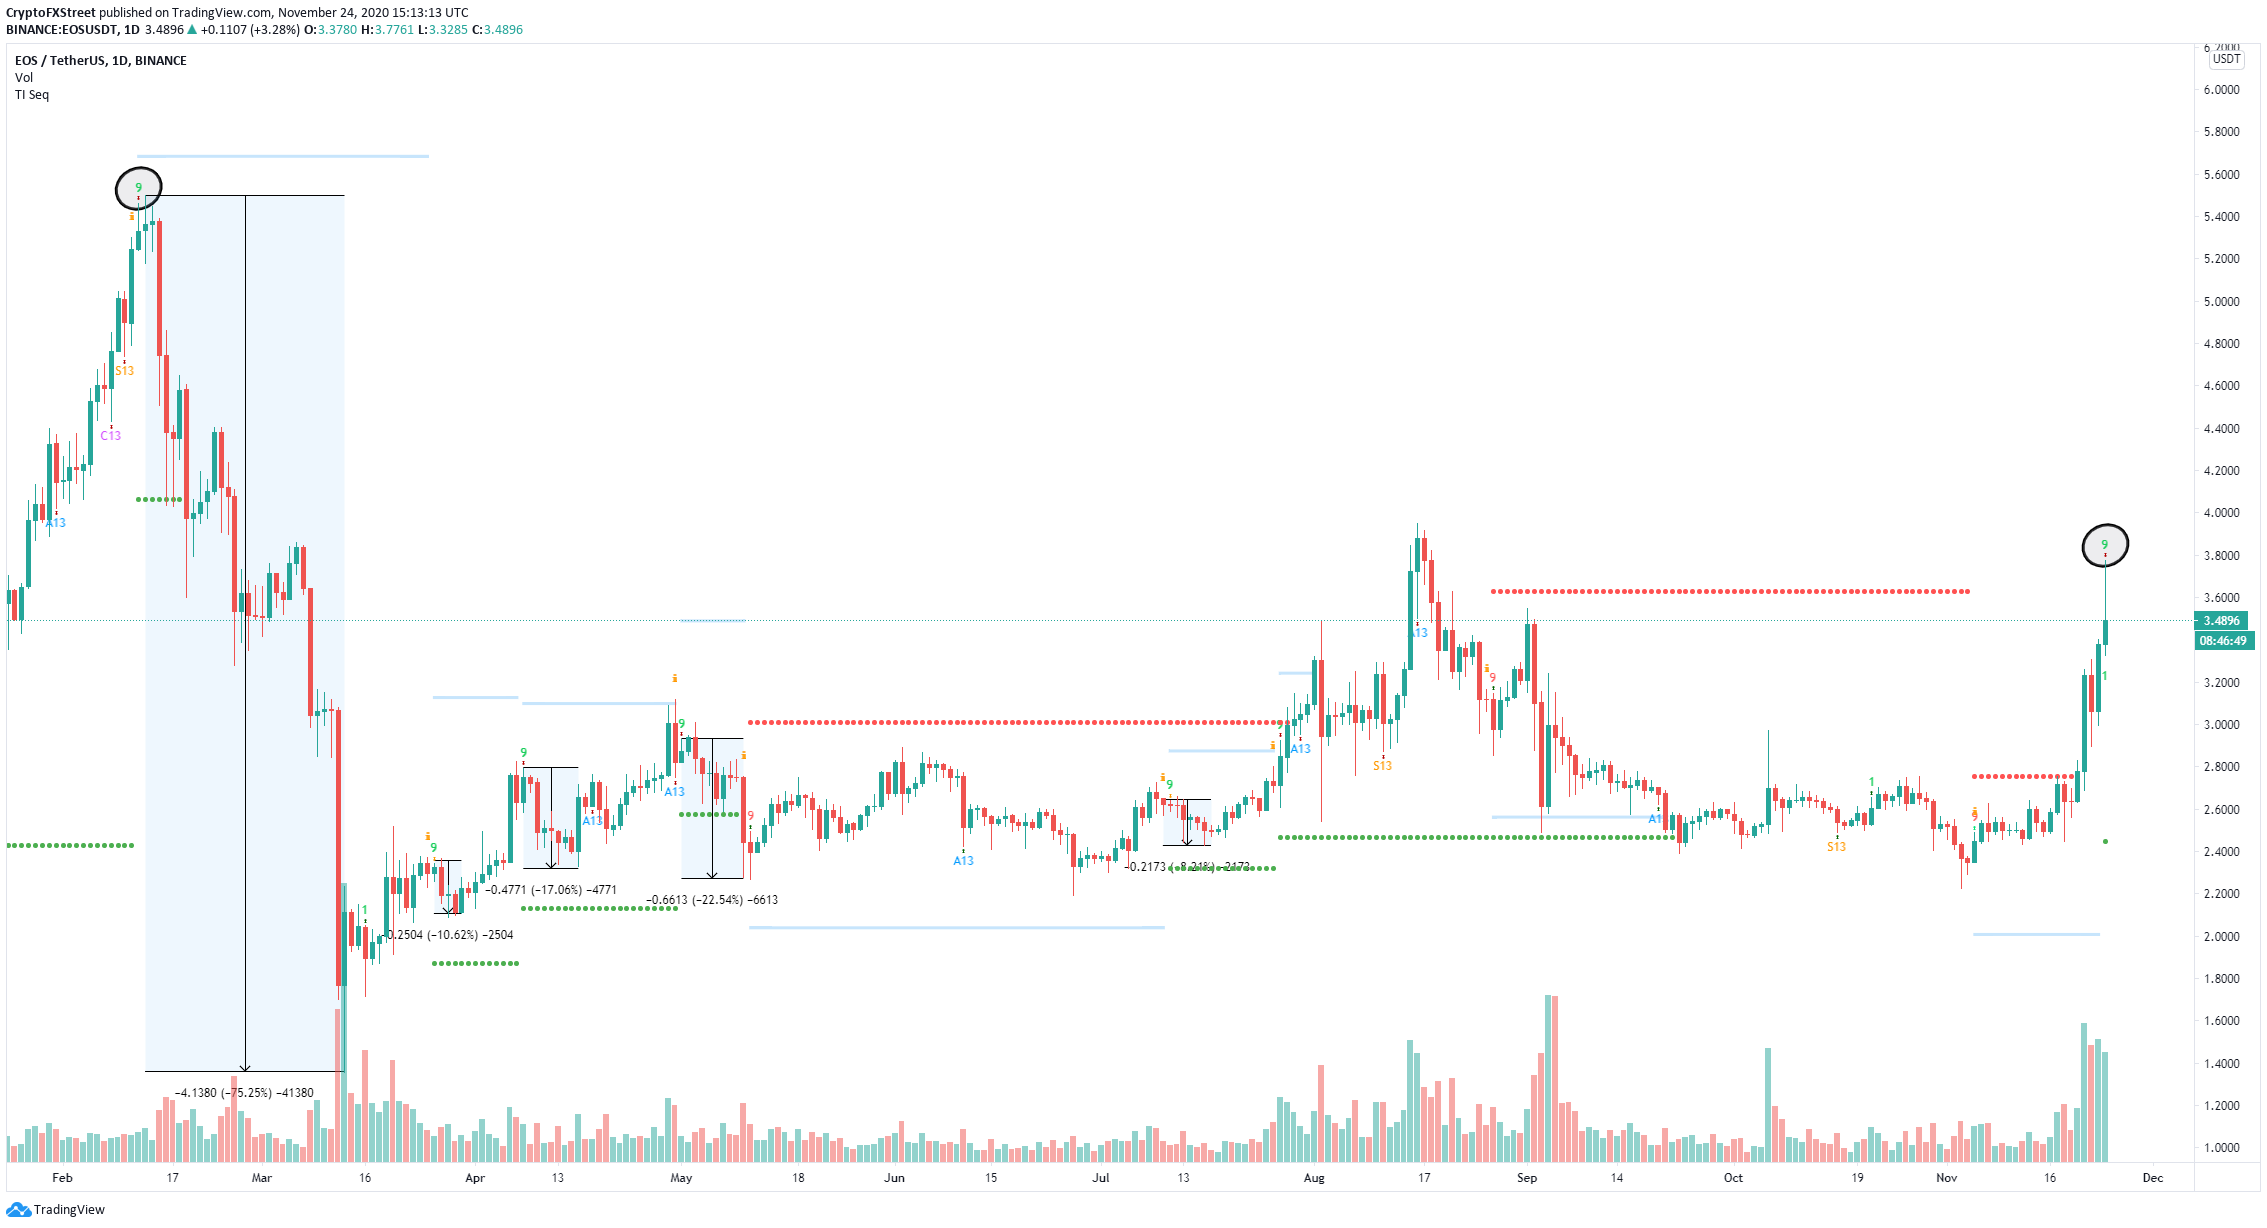
EOS/USD daily chart
Additionally, it seems that all sell signals presented by this indicator since February have been validated. On the 12-hour chart, the TD Sequential has just also posted a sell signal in addition to another on the 4-hour chart.
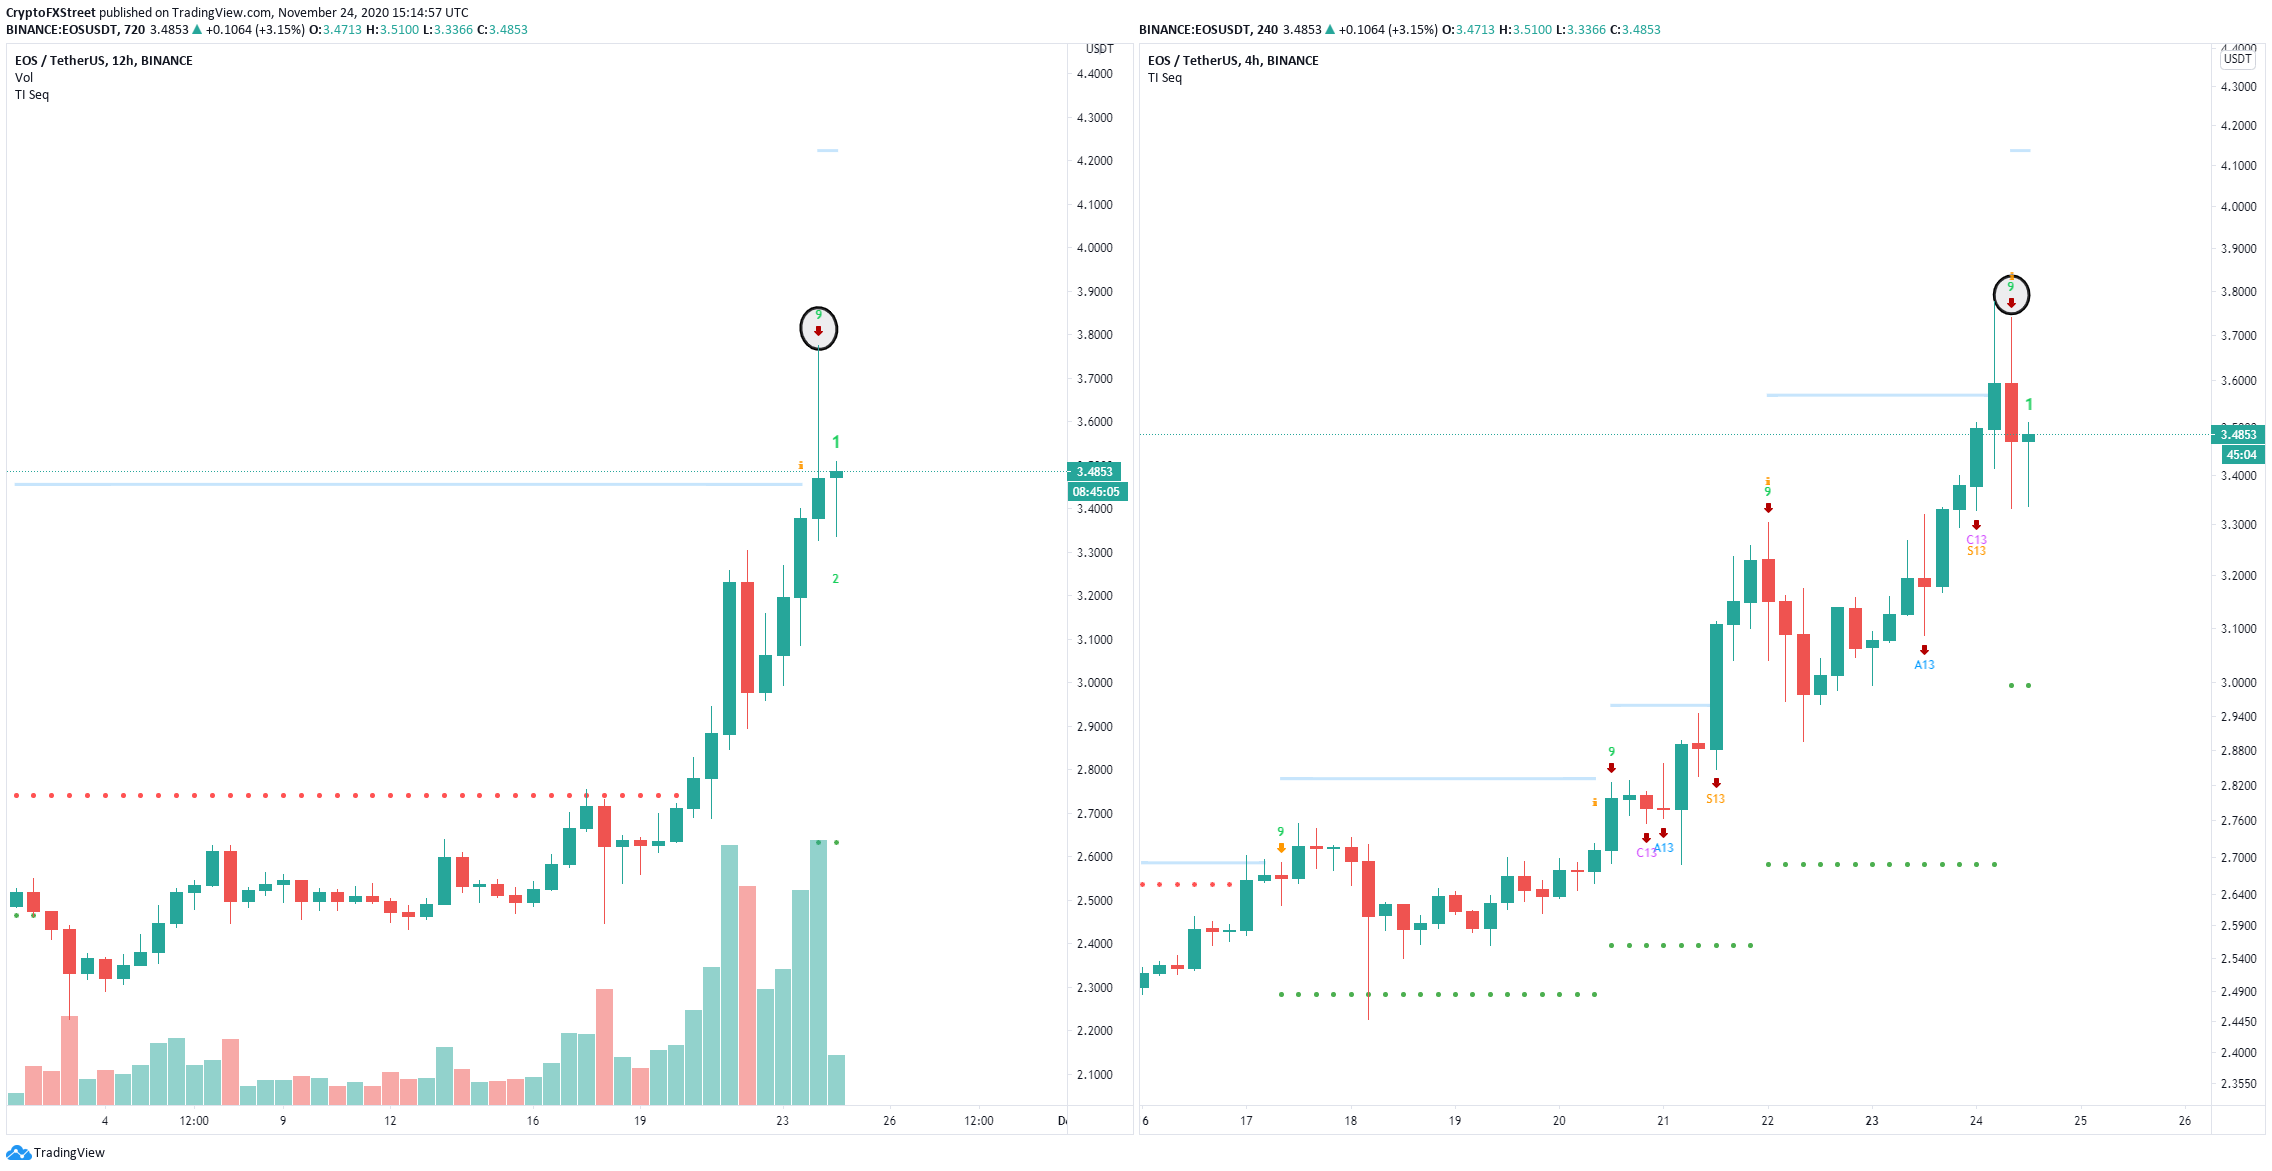
EOS/USD 12/4-hour charts
The validation of all three signals could quickly send EOS price towards the psychological level at $3 and as low as $2.8, where the 50-SMA is established on the daily chart. On the other hand, climbing above the last high at $3.77 would drive EOS price to the 2020-high at $5.499 as the market remains heavily bullish.
