- EOS/USD is priced at $3.21 in the early hours of Friday.
- The relative strength index (RSI) curve has crept into the oversold zone.
EOS/USD daily chart
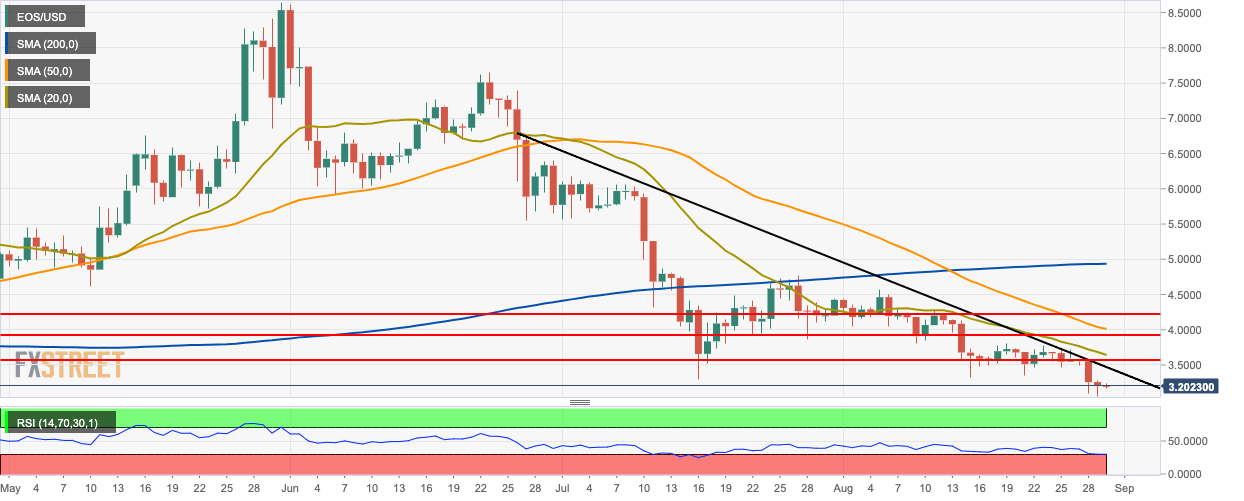
EOS/USD is on the course of having a bullish day after three straight bearish days. Over Tuesday, Wednesday, and Thursday, the price of EOS/USD had fallen from $3.58 to $3.20. So far, the bulls were able to take the price up to $3.21 slightly. The price has found resistance on the downward trending line and is trending below the 200-day simple moving average (SMA 200), SMA 50 and SMA 20 curves. The relative strength index (RSI) curve has crept into the oversold zone.
EOS/USD 4-hour chart
-637027337381823338.png)
The 4-hour EOS/USD price chart shows that a sudden bearish move which took the price below the 20-day Bollinger band, indicating that it was underpriced. Since then, the price trended horizontally and re-entered the Bollinger band. The moving average convergence/divergence (MACD) indicator shows decreasing bearish momentum.
EOS/USD hourly chart
-637027336833836573.png)
The hourly EOS/USD chart was trending horizontally when it suddenly plunged from $3.20 to $3.08. Immediately after that, the EOS/USD price went up from $3.08 to $3.19, indicating that the bulls rallied together and fought back. Elliott oscillator shows sustained bullish momentum.
Key Levels
