- EOS/USD is currently trading for $3.31 in the early hours of Thursday.
- Moving average convergence/divergence (MACD) indicator shows that the bulls have slightly edged out the bears.
EOS/USD daily chart
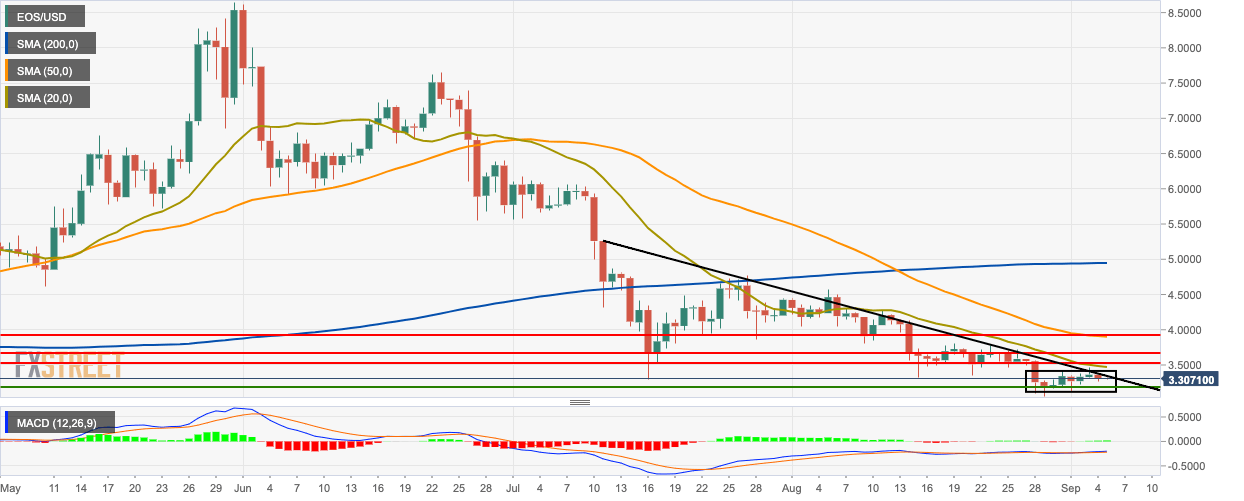
EOS/USD is trending horizontally in a sluggish manner and trying to break above the downward trending line. The price chart is also trending below the 200-day simple moving average (SMA 200), SMA 50 and SMA 20 curves. The moving average convergence/divergence (MACD) indicator shows that the bulls have slightly edged out the bears.
EOS/USD 4-hour chart
-637032548884204788.png)
The 4-hour chart is trending below the green Ichimoku cloud, SMA 200, and the SMA 20 curve. The SMA 20 has crossed over the SMA 50 curve, which is a bullish sign. The Elliott oscillator has had seven straight bearish sessions.
EOS/USD hourly chart
-637032548554506803.png)
The hourly EOS/USD chart has found resistance on the SMA 200 curve and is currently trending on the lower half of the 20-day Bollinger band. We can also see that EOS had gone up from $3.30 to $3.35 yesterday, where it experienced resistance at the SMA 50 curve and then dropped down. The relative strength index (RSI) indicator is trending around the neutral zone.
Key Levels
