EOS/USD Daily Chart
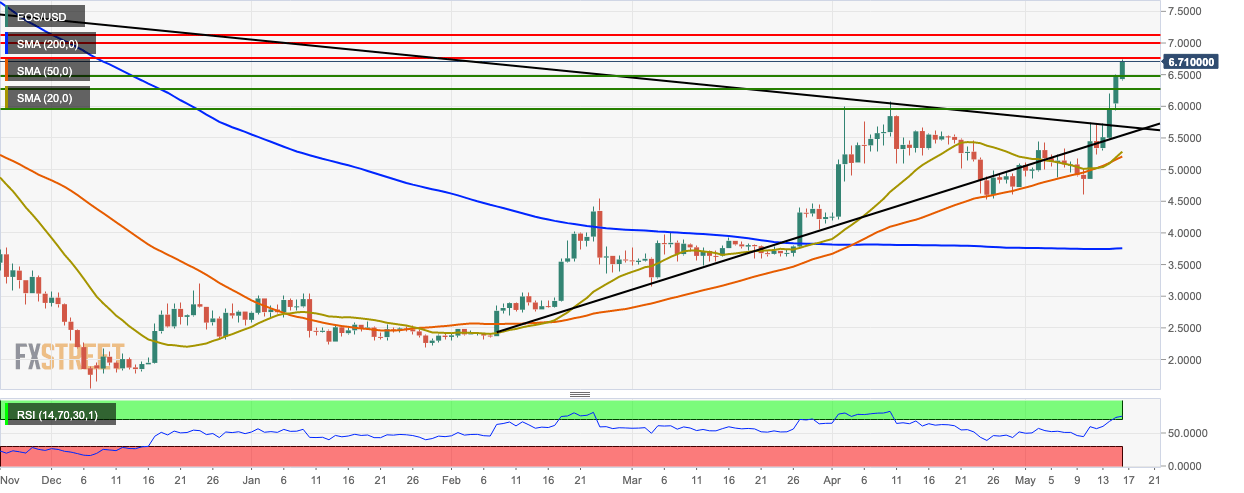
- EOS/USD went up from $6.43 to 6.71 in the early hours of Thursday.
- The market has had a bullish breakout from a triangle formation.
- The SMA 20 curve converged with the SMA 50 curve but then instantly diverged away, which is a bullish sign.
- The relative strength index (RSI) indicator has crept into the overbought territory.
EOS/USD 4-Hour Chart
-636935718196688824.png)
- The widening of the 20-day Bollinger band shows increasing market volatility.
- The MACD indicator shows continued bullish momentum.
- The latest session has crept outside the upper curve of the Bollinger band.
- Nearest resistance lies at $6.75.
EOS/USD Hourly Chart
-636935718657325641.png)
- The hourly EOS/USD chart shows a head and shoulders pattern as indicated by the rectangles.
- The Ichimoku indicator shows the possibility of a near-term bearish correction.
- The Elliot Oscillator has had three consecutive bullish sessions.
Key Levels
