Home EOS Technical Analysis: EOS/USD moving within a descending wedge pattern
Crypto News

EOS Technical Analysis: EOS/USD moving within a descending wedge pattern

  • EOS price on Friday seen trading marginally in the green up just some 0.10%.
  • EOS/USD price action is bouncing within a descending wedge pattern, subject to a breakout higher.  


EOS/USD 60-minute  chart  
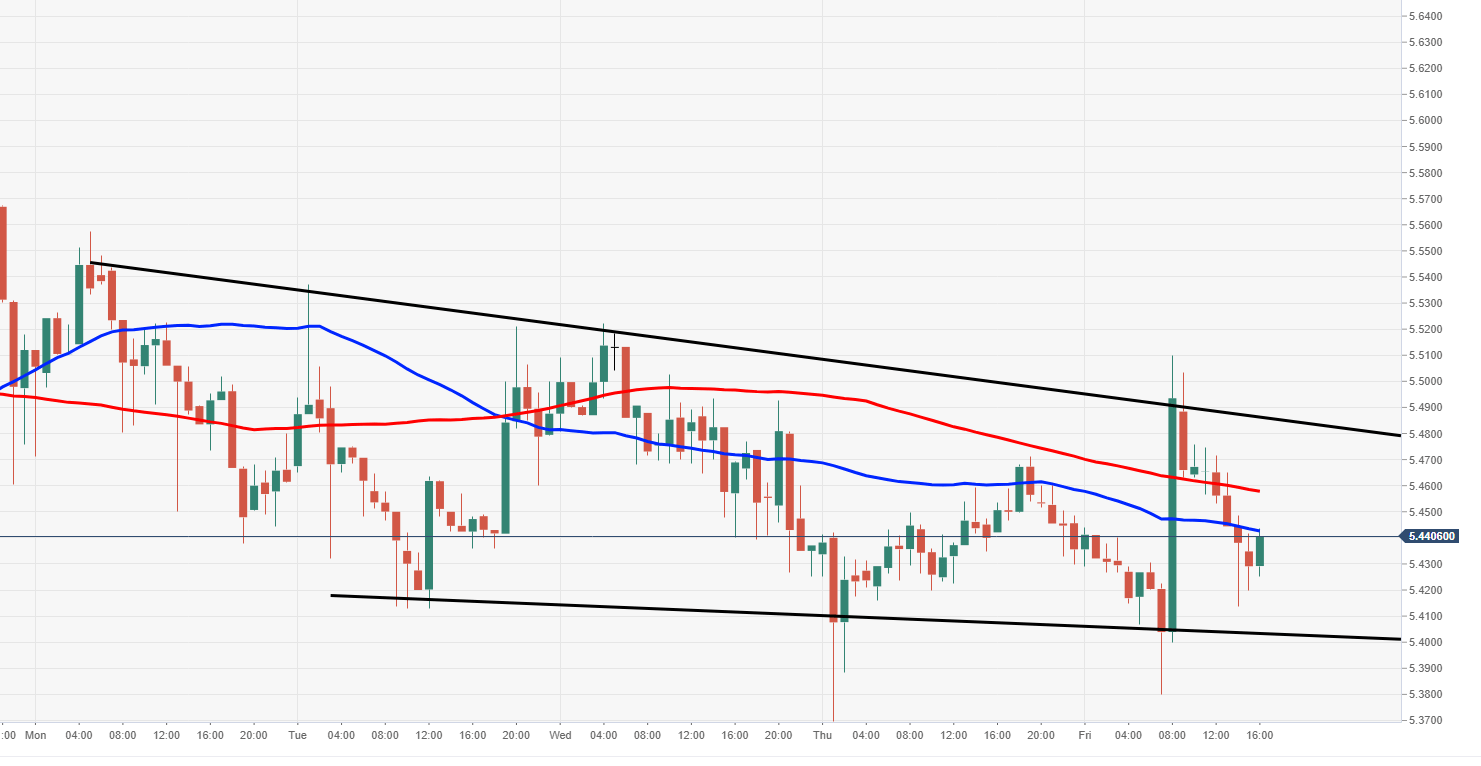


Spot rate:                   5.4336

Relative change:       +0.10%

High:                          5.5097

Low:                           5.3807


Trend:                        Neutral


Support 1:                  5.4035, lower part of wedge.

Support  2:                  5.3700, demand area.

Support  3:                  5.3278, 19 October low.

Resistance  1:             5.4431, 50MA.

Resistance  2:             5.4600, 100MA.

Resistance  3:             5.4880, upper part of wedge.

FX Street

FX Street

FXStreet is the leading independent portal dedicated to the Foreign Exchange (Forex) market. It was launched in 2000 and the portal has always been proud of their unyielding commitment to provide objective and unbiased information, to enable their users to take better and more confident decisions.