EOS/USD daily chart
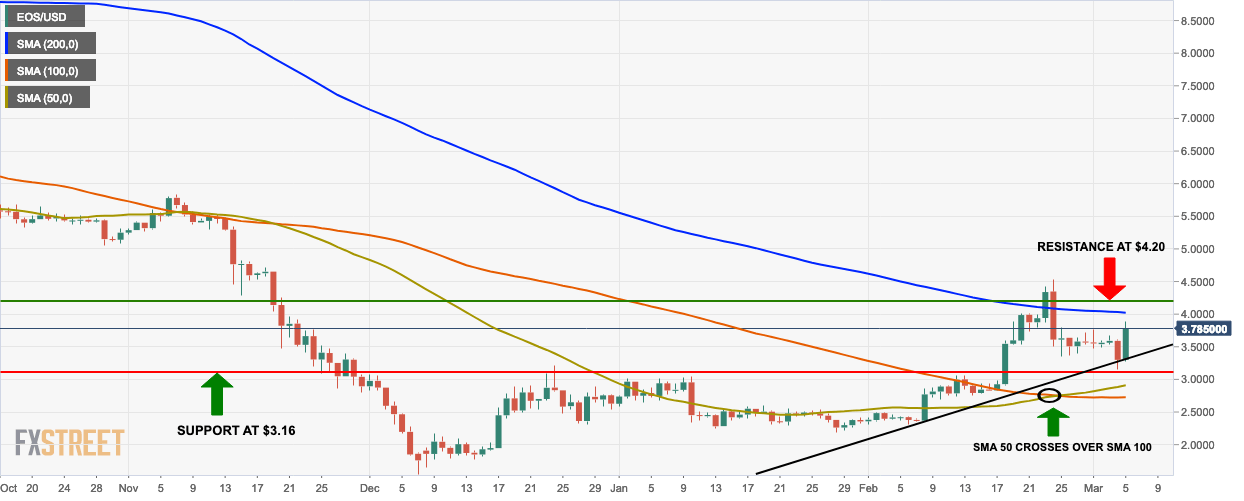
- EOS/USD price went up by 15% from $3.30 to $3.79.
- The market is still trending above both the 100-day simple moving average (SMA 100) and SMA 50 curves.
- The SMA 50 has already crossed over the SMA 100, which is a buy signal.
- The bulls will want to break past the SMA 200 curve to continue upward momentum.
EOS/USD 4-hour chart
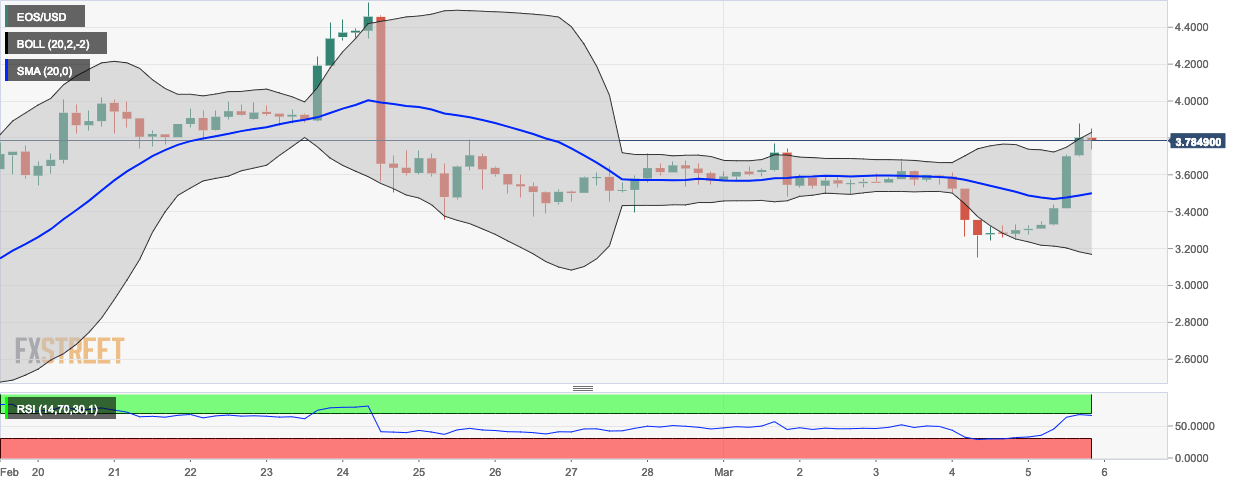
- Even though the last session in the EOS/USD 4-hour chart is bearish, the market is still trending near the upper curve of the 20-day Bollinger band.
- The Bollinger band also shows that the market is becoming more volatile.
- The relative strength index (RSI) curve is creeping into the overbought zone.
EOS/USD hourly chart
-636874265534547998.png)
- The moving average convergence/divergence (MACD) histogram shows decreasing bullish momentum.
- The hourly chart forms a flag formation and the price seems to have had a bullish breakout from it.
