EOS/USD daily chart
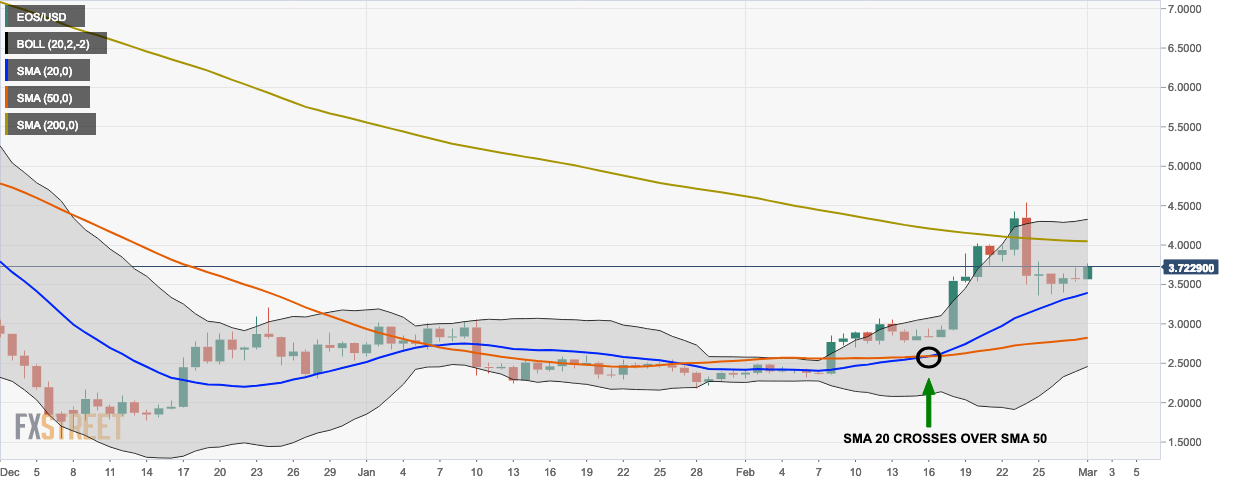
- EOS/USD went up from $3.57 to $3.72, gaining 4.2% in the process.
- The 200-day simple moving average (SMA 200) curve acts as a resistance to the market.
- The SMA 20 has crossed over the SMA 50 curve which indicates a buy signal.
EOS/USD 4-hour chart
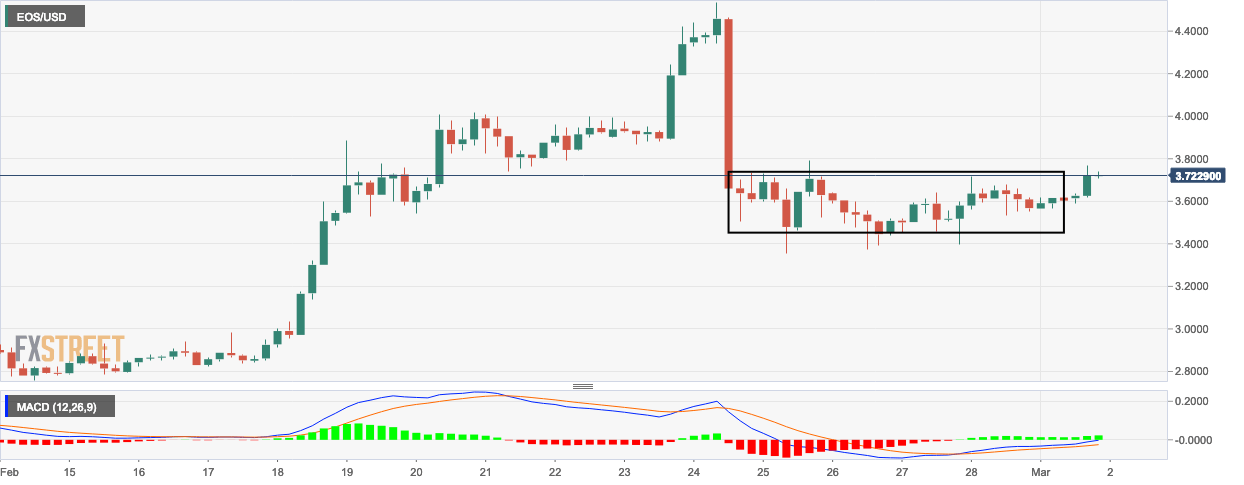
- The 4-hour EOS/USD chart shows that the price has been contained for an elongated period and is prime for a breakout.
- The moving average convergence/divergence (MACD) shows increasing bullish momentum.
EOS/USD hourly chart
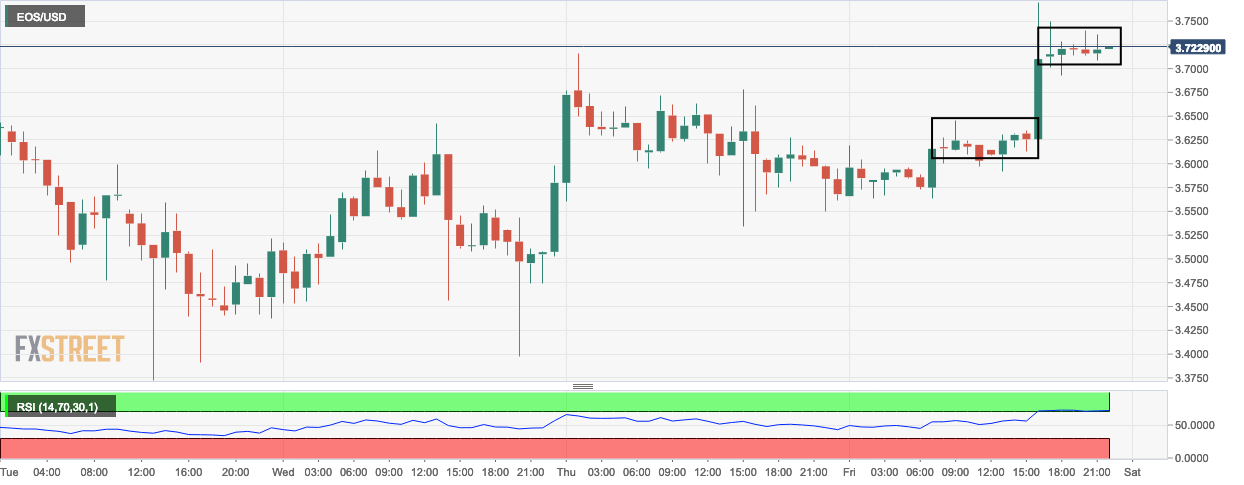
- The hourly EOS/USD chart shows a couple of bullish flags and is ready for a breakout from the latest formation.
- The relative strength index (RSI) has crept into overbought territory.
Key Levels
- Resistance 3: $48.3572
- Resistance 2: $47.5512
- Resistance 1: $46.7187
- Pivot Point: $45.9127
- Support 1: $45.0802
- Support 2: $44.2742
- Support 3: $43.4417
