- EOS trades 1.2% higher as cryptocurrency sentiment is positive today.
- The RSI indicator is showing signs upside momentum could be wearing thin.
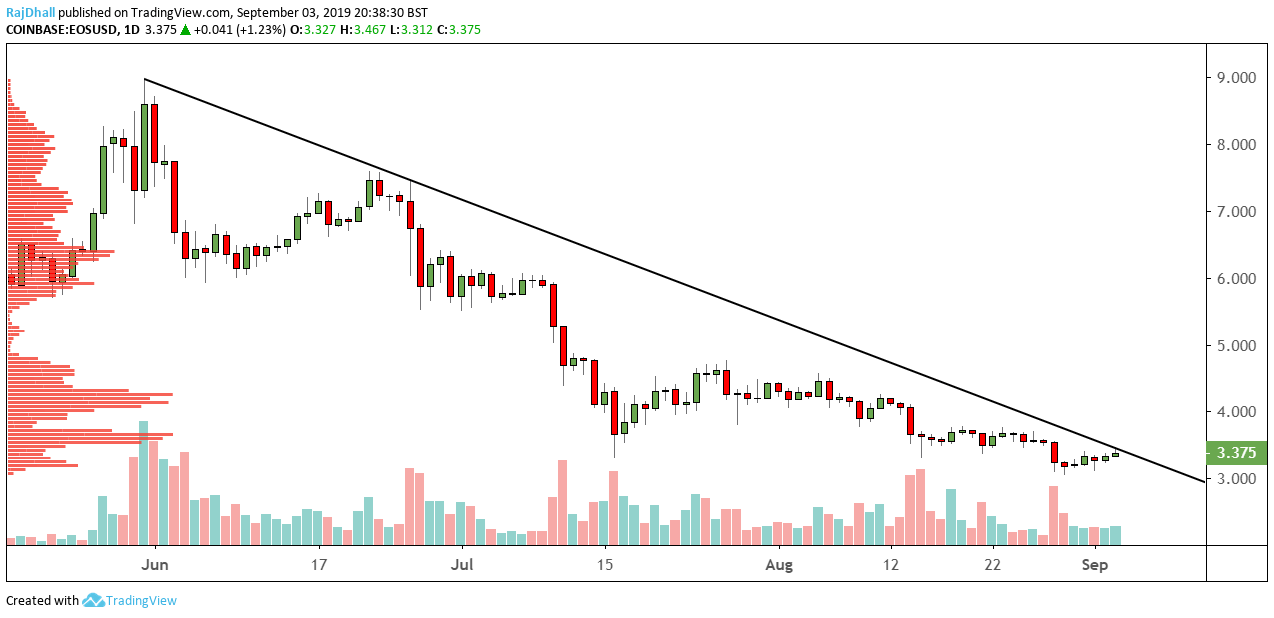
- Most of the big moves in EOS have been to the downside with lage volume in recent times.
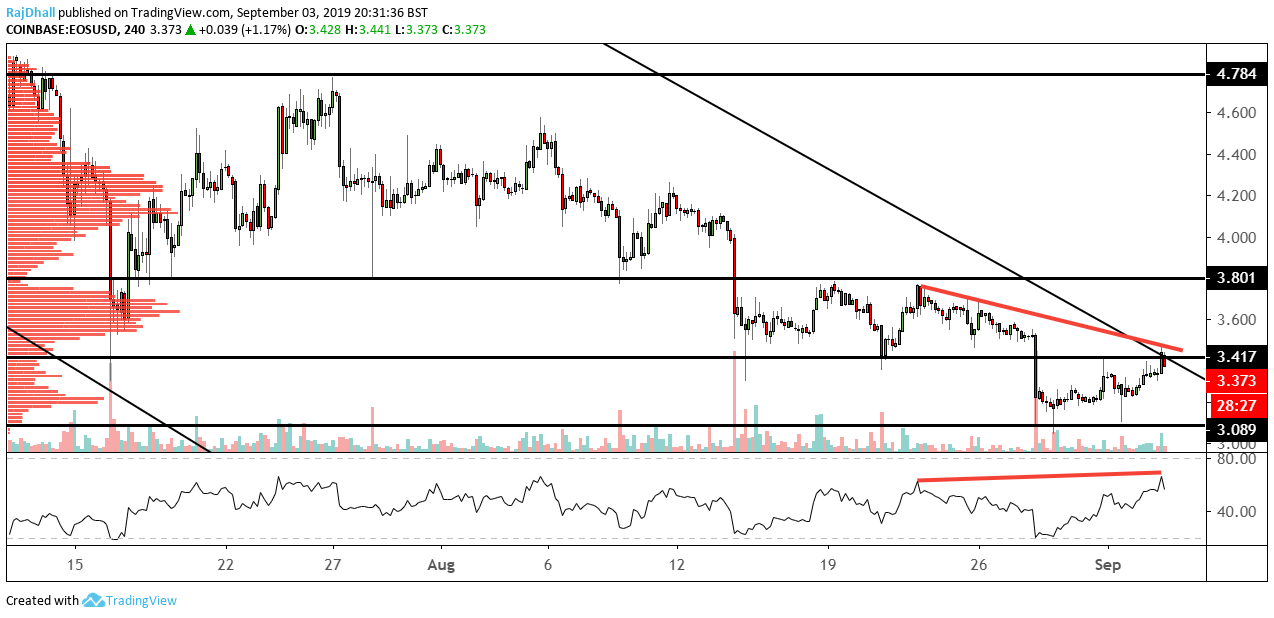
Above is the 4-hour EOS/USD chart and it has broken a major trendline on the higher timeframes (see chart below).
The RSI indicator is showing something called a bearish failure swing, this is sometimes known as a bearish hidden divergence. It can be an indication that prices may fall from here.
On the downside 3.00 seems to be an area of psychological support but now price waves have made a higher high and higher low we could see a break of the next resistance at 3.41 which price briefly printed above earlier on in the session.
The major support level on the 4-hour chart above is at 3.80. On this chart alone it has been tested six times and looking at the composite volume profile indicator on the left-hand side of the chart it also has a low volume node which also indicates strength.
Price is a far cry away from the 9 level seen back in June. In terms of fundamental news cryptocurrency trust and security company, BitGo has announced the launch of a multisignature wallet and custody service for EOS on August 25th, but the price didn’t really react.