- EOS pushes 2.32% higher to print above 3.000 for the session.
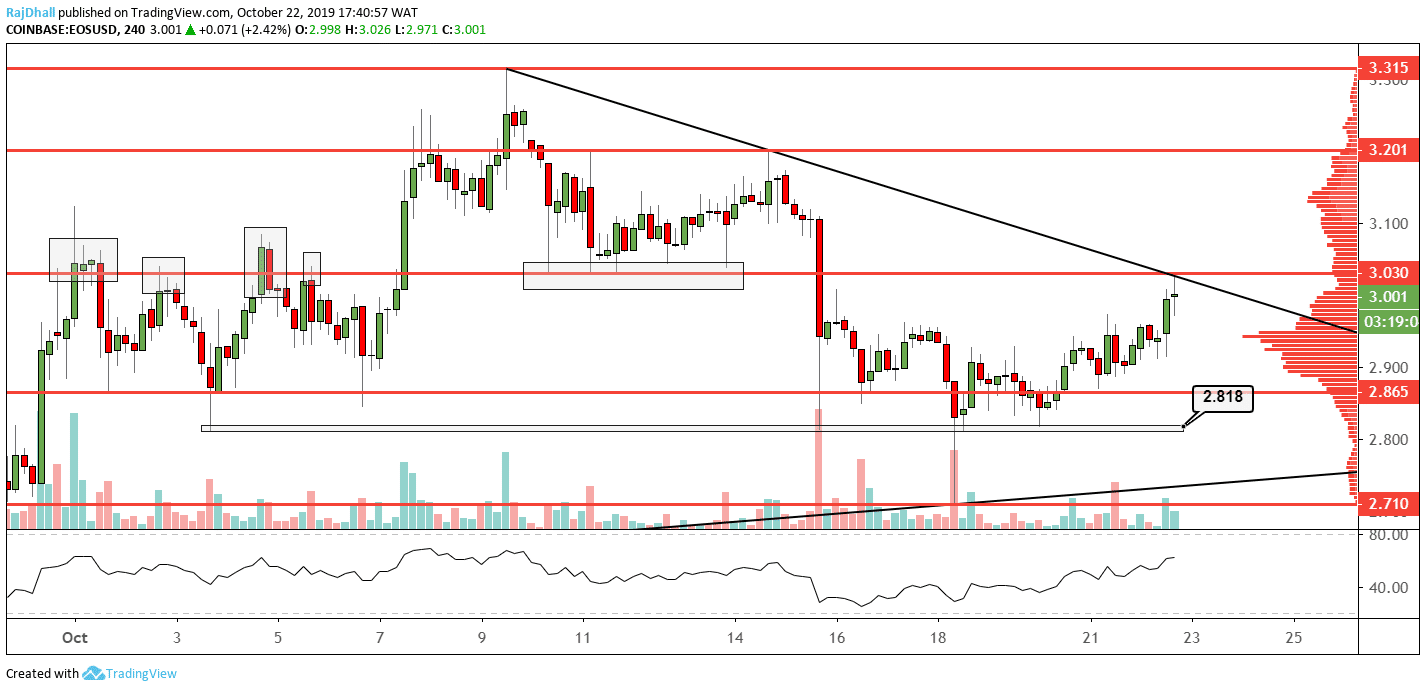
- There was a dual resistance zone when a trendline and resistance level met.
EOS/USD just spiked higher through the 3.000 resistance point and found some resistance.
The fact that the price found some resistance was not surprising as there is a psychological round number and a trendline confluence at the area.
It has been a fairly decent move higher since the price found a base at 2.818 on October 20th.
Now the RSI indicator has also moved above the mid-line and looks quite positive.
Elsewhere, on the volume profile indicator, the price is now above the peak of the bell curve.
This suggests that we may be entering a more bullish phase as it was quite a sticky point for EOS/USD.
Now for the bulls to really gather momentum the trendline and the resistance zone need to be taken out.