- EOS/USD is one of the worst-performing altcoins today after the price fell 7.18%.
- Most of the crypto majors are trading lower today as sentiment remains soft.
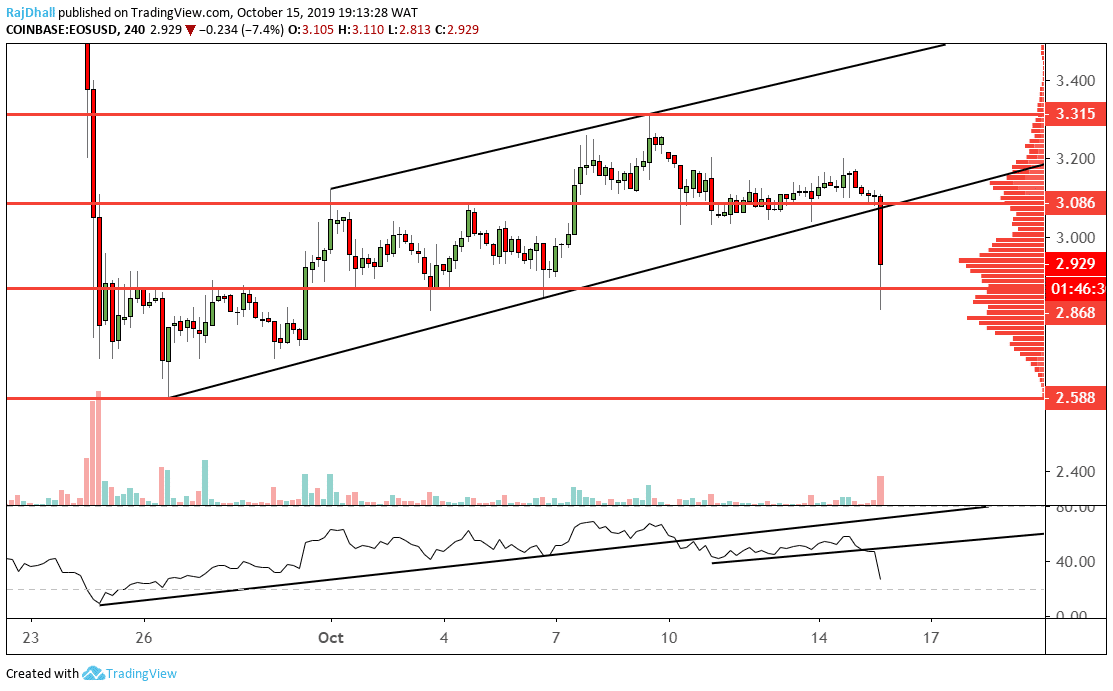
The pair has broken a bear flag formation that formed on the four-hour chart and is now heading to the base of the formation at 2.588.
The psychological 3.000 level has also been broken now and the price is currently holding at 2.939 after finding some support at 2.868 a level used five times in the past as support and resistance.
The relative strength index (RSI) has also broken lower and taken out two trendlines in recent times. The indicator has not reached the oversold level which could suggest there is some more downside momentum on the way.
From a volume perspective, it really seems like the sellers are in control as this move gave us the highest spike in volume since September 27th when the market found some support at 2.729.
In regards to the mean value area, the price is currently holding there. 2.935 is the price where most contracts changed hands on the Coinbase exchange and could be used as a pivot level.
Now the lower high lower low formation has been made a run on the 2.588 wave low could be the next move. If that level breaks we are sure to have confirmed a new downtrend.