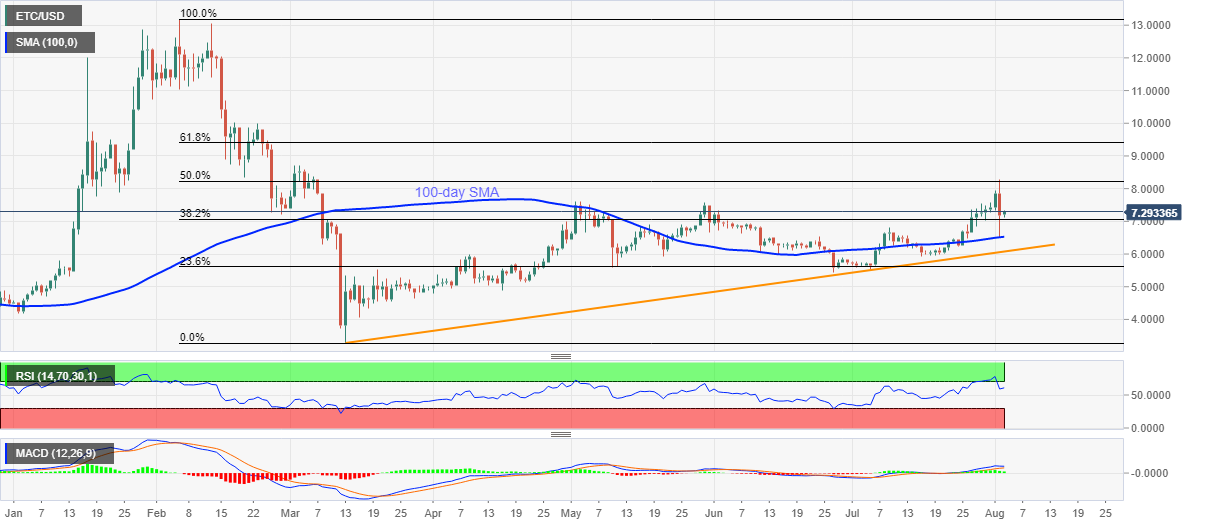
- ETC/USD consolidates the previous day’s losses from 50% Fibonacci retracement.
- RSI, MACD also not inclined to open doors for sellers.
- An ascending trend line from March 13 adds to the downside support.
ETC/USD retraces from the lowest in a week to 7.2900, up 1.60% on a day, during the early Monday. In doing so, the pair takes a U-turn from 100-day SMA, which in turn again pushes in north towards 50% Fibonacci retracement level of February-March downside. Also supporting the bulls are the upbeat MACD signals and a lack of overbought RSI conditions.
However, highs marked on May 30 and May 02, respectively near 7.5635 and 7.6175, could act as intermediate resistances before attacking 8.000 round-figures and 8.2297 mark comprising the 50% Fibonacci retracement.
Should the quote surpasses 8.2300 level on a daily basis, it can aim for March month’s high of 8.7073 before targeting 61.8% Fibonacci retracement near 9.3981.
Alternatively, a 38.2% Fibonacci retracement level of 7.0610 may act as buffer supports ahead of a 100-day SMA level of 6.5282.
Moreover, an upward sloping trend line from early-March, at 6.0795 now, could also question the bears.
ETC/USD daily chart
Trend: Bullish

