- ETC/USD sees little potential for growth as the price sits on the $4.27 support line.
- Strong resistance lies at $4.35 and $4.40, according to the confluence detector.
It looks like ETC/USD has entered a period of stabilization after facing the 51% attack. The price is sitting on the $4.27 support line. The scope of growth is extremely limited as ETC/USD is facing two strong lines of resistance at $4.35 and $4.40. The bulls have been trying to break past these two points of resistance for the last three days but have failed to do so.
ETC/USD daily confluence detector
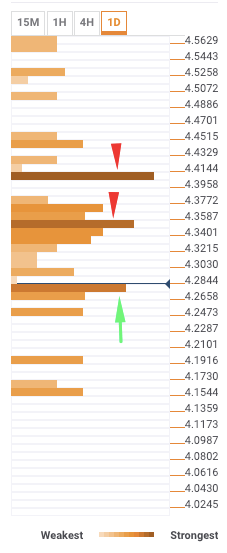
ETC/USD is supported at $4.27 by the 61.8% Fibonacci retracement level on a monthly basis. Apart from that, it doesn’t really have any other support lines of note. ETC/USD faces two strong lines of resistance at $4.35 and $4.40.
The $4.35 line sees a confluence of various simple moving average levels, Bollinger band 15-min upper, Bollinger band 1-hour middle, and 23.6% Fibonacci retracement level daily. This is a very strong line of resistance which will take some effort from the bulls to break past.
The next level of resistance likes at $4.40. This line has successfully thwarted the bulls for the last three days. This level sees a confluence of Bollinger band 4-hour upper and the 61.8% Fibonacci retracement level daily.
The buyers need to fight very vigorously to get past these two strong lines of resistance. Another thing to note here is that ETC/USD currently has no other strong lines of support apart from the $4.27 line. The bears are already testing this and the bulls need to make sure that the support doesn’t get breached.
