- Are we headed for a bearish break in ETC/USD.
- Ethereum Classic is down 1.41% today as crypto sentiment is weak.
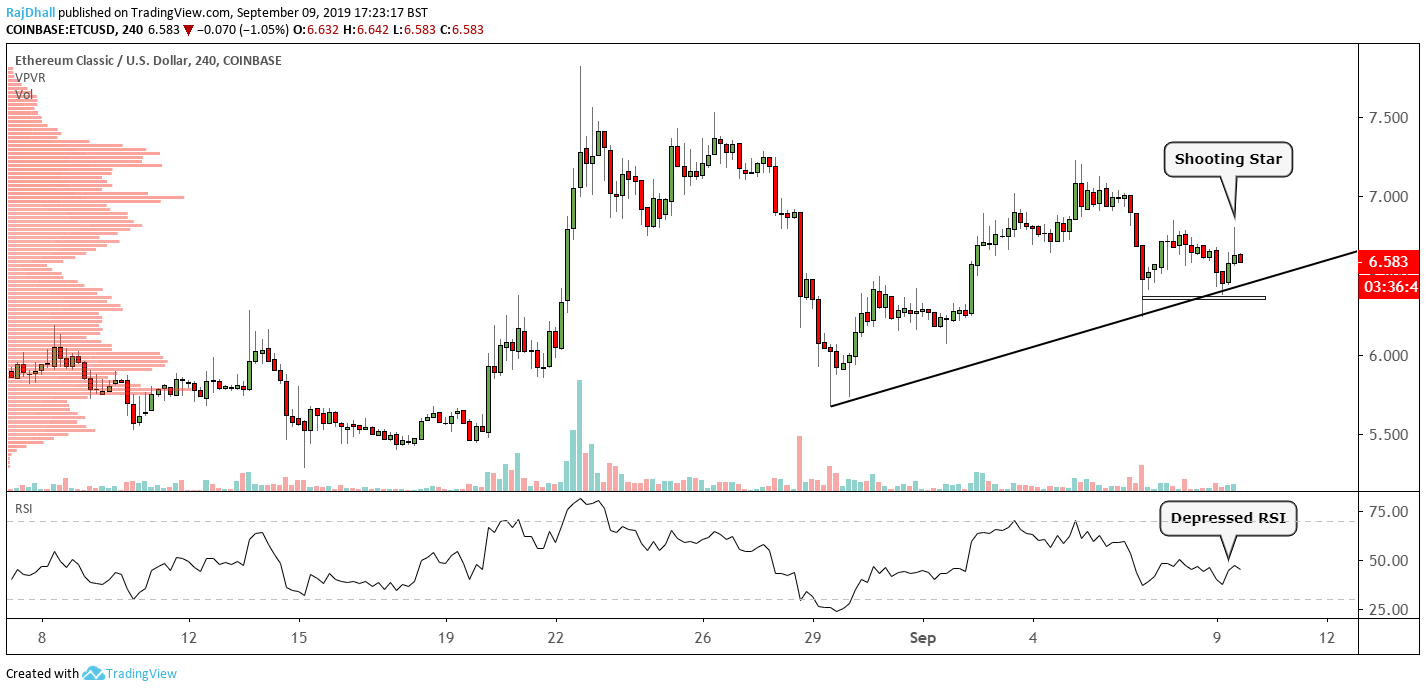 Ethereum Classic is looking weak on the 4-hour chart but could used some confirmation to confirm the turn lower.
On the 4-hour chart there has been a shooting star candlestick formation which can indicate a move lower is about to come.
In this case a break of 6.372 would confirm the next lower high lower low formation in price action.
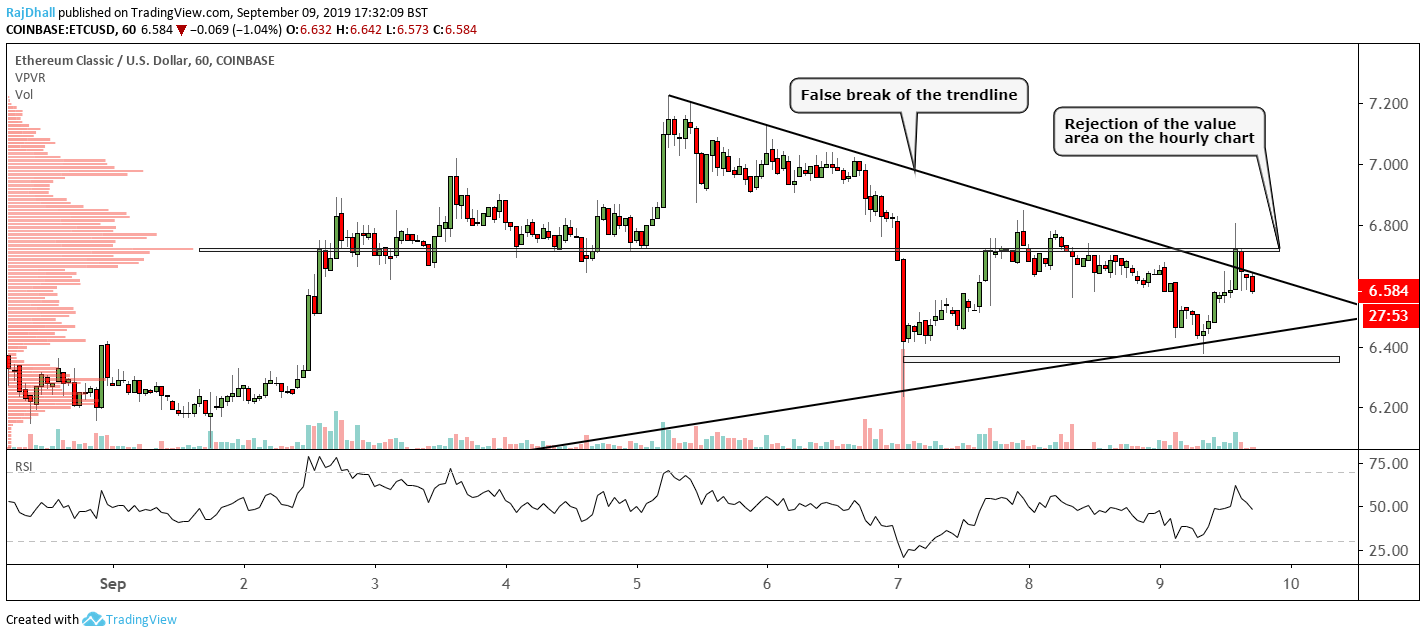
On the upside 7.000 seems to be rejected and used as a psychological resistance level.
There is also a trendline that is marked by a black diagonal line on the chart. Bears would also have to contend with some support there to break to lower levels.
The RSI is also looking weak and has not yet reached a the oversold level so there could still be some momentum left in this move.
On the hourly chart below there is something that negates the bearish view. There was a break of the trendline to the upside which is bullish. The price immediately came back inside the structure which could mean it was a false break but only time will tell.
On the left hand side of the chart the volume profile indicator is showing that the main value area distribution on the chart is at 6.721 and this was rejected.