- Bulls face stiff resistance at the SMA 50, 0.02336 and 0.02387.
- William’s %R has been trending inside the overbought zone for the last five days, so the price may face bearish correction soon.
ETH/BTC daily price
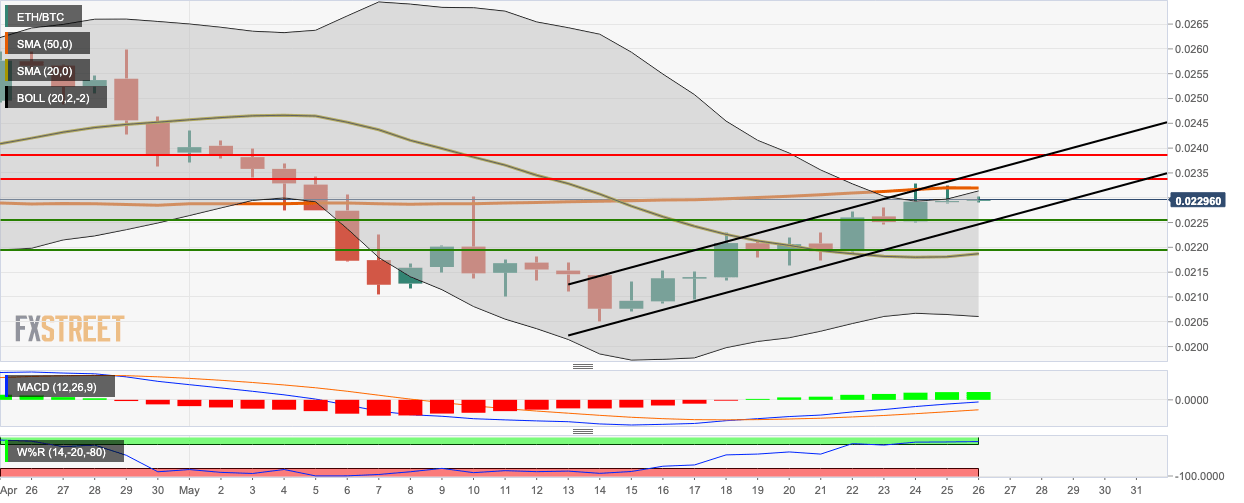
ETH/BTC bulls remained in control for the third consecutive day as it went up from 0.022947 to 0.02296. ETH/BTC is currently trending in an upward channel pattern. Over the last two days, the price has threatened to cross above the 20-day Bollinger Band, which has since widened to indicate increasing price volatility. William’s %R has been trending inside the overbought zone for the last five days, so the price may face bearish correction soon. The MACD shows increasing bullish momentum.
The bulls face multiple stiff resistance levels at SMA 50, 0.02336 and 0.02387. On the downside, there are healthy support levels at 0.02255, SMA 20 and 0.02196.
Key levels
