- ETH price remains bullish as it breaks outside the descending parallel channel price range.
- IOMAP shows Ethereum is sitting on strong support around $2,337 with relatively weak upward hurdles.
On Friday the ETH price broke above the $2,400 psychological level for the third time this week as shown on the four-hour chart. Before that, ETH rose approximately 30% from a low of around $1,713 to on July 20 to close the day at around $2,222 on Monday. During the upswing, Ethereum flipped the 50-day and the 200-day Simple Moving Averages (SMAs) from support to resistance and reversed the parabolic SAR from positive to negative as seen on the four-hour chart.
ETH Price Upward Rally Depends On This Crucial Support
Ethereum has been bullish since July 21 rising by approximately 32% from $1,713 to the current price at $2,435. On Monday, the bullish run saw the ETH price record highs above the $2,400 mark. However, the bullish momentum was not strong enough to keep Ethereum price above the $2,400 psychological level as it retracted on to close the day in the red at $2,222.
During today’s early trading sessions, Ethereum broke outside the trading range defined by the descending parallel channel to rise above the $2,400 mark. ETH is currently hovering around $2,435 on most crypto exchanges and appears to be battling immediate resistance at $2,536 where it coincides with the 100-day SMA. Note that a daily closure above this level could see Ethereum explore the June 26 highs above the $2,600 psychological level.
ETH Price Four-Hour Chart
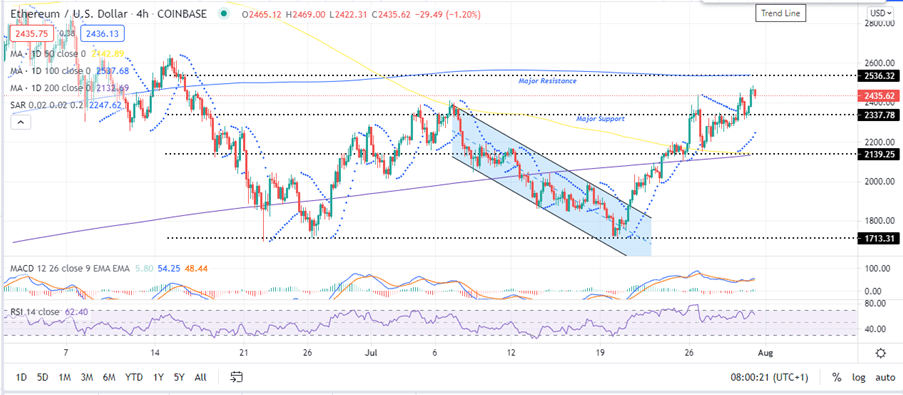
Note that for this narrative to hold, bulls must defend the support at around $2,337 to make sure that overhead pressure does not push Ethereum price below this point.
- Are you new to crypto trading? Read the how to buy cryptocurrency guide to get started.
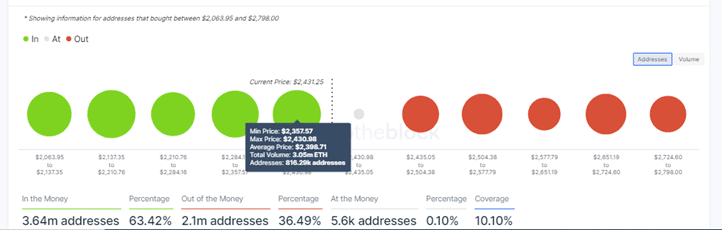
On-chain metrics by IntoTheBlock’s In/Out of the Money Around Price (IOMAP) indicate that the support at $2,337 is relatively strong to keep ETH price going higher. It lies within the $2,300 and $2,430 investor cluster where approximately 3 million ETH were previously bought by roughly 816,000 addresses.
The same IOMAP model shows that Ethereum price fac
es relatively weak resistance upwards. The major resistance at $2,536 lies with the $2,504 to $2,577 price range where only 519,00 addresses previously bought 1 million ETH.
Compared to the support downward, this resistance should not be a problem to bulls who seek to break out above $2,500 to push the ETH price to the moon.
Ethereum Price IOMAP Model
How Can the Bullish Outlook Be Invalidated?
On the flip-side, if Ethereum fails to close the day above the $2,500 psychological level, sellers might enter the scene to push the ETH price lower. If this happens, ETH could re-test the $2,270 or the $2,139 support where the 50-day and the 200-day currently lie.
Also note that a death cross could happen in the near-term that could trigger a downswing that could see Ethereum drop to the July 20 low at $1,713.
Looking to buy or trade Ethereum now? Invest at eToro!
Capital at risk
