ETH/USD daily chart
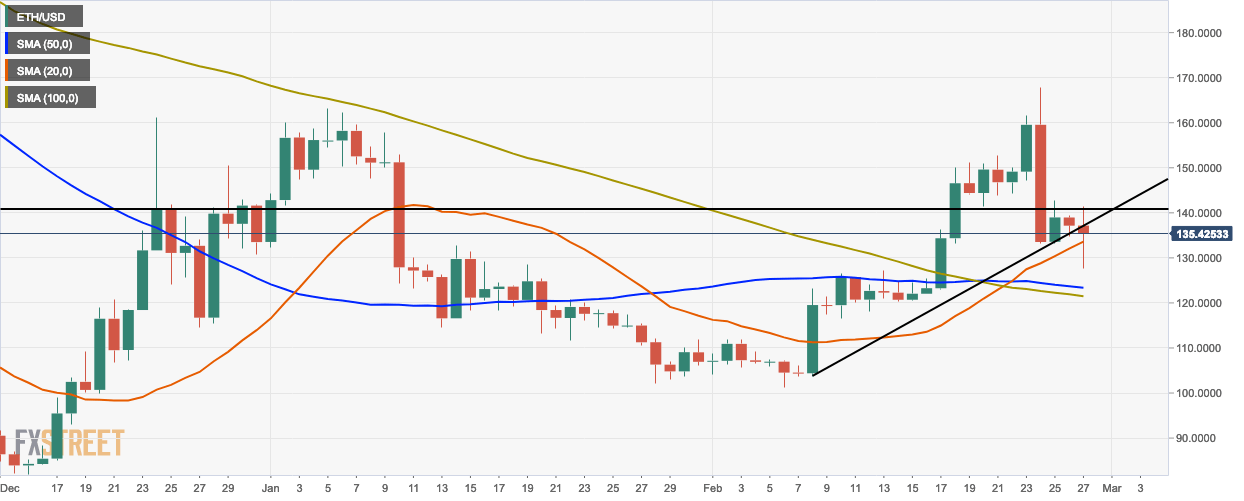
- The ETH/USD daily chart shows that the market has had a bearish break out from the triangle formation.
- The 20-day simple moving average (SMA 20) curve has crossed over the SMA 50 and the SMA 200 curves to show a strong buy signal.
ETH/USD 4-hour chart
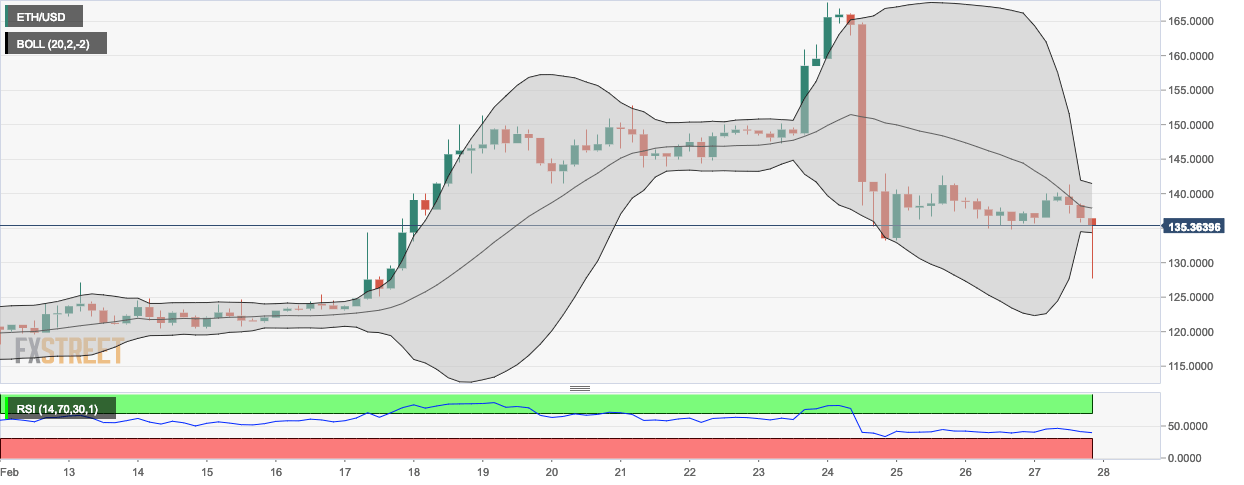
- The ETH/USD 4-hour chart shows that the market is trending below the SMA 20 curve.
- The 20-day Bollinger band shows that the market is becoming less volatile.
- The relative strength index (RSI) graph is creeping towards the oversold territory.
ETH/USD hourly chart
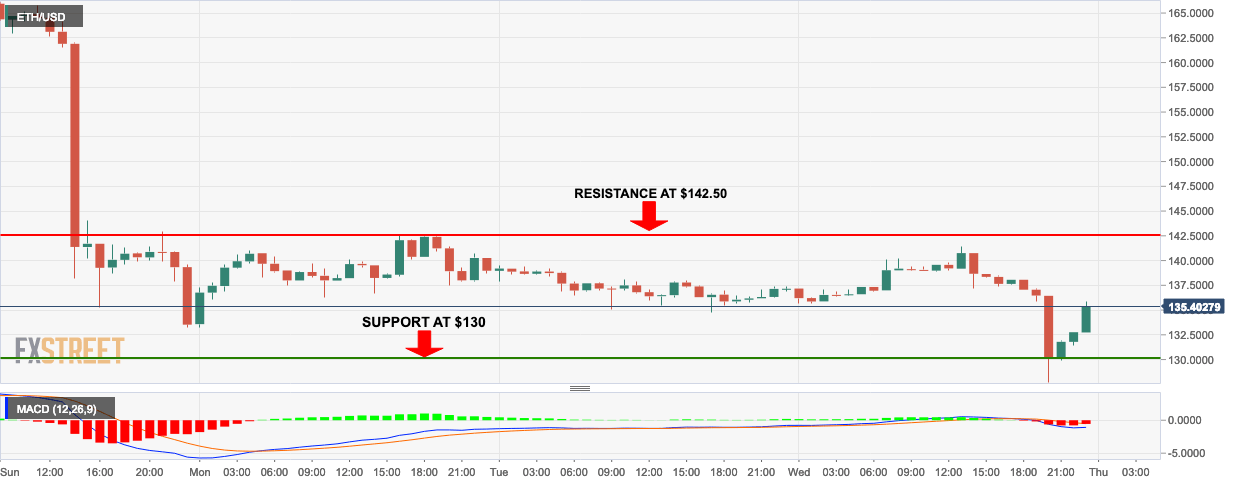
- The bulls have fought back convincingly over the last three sessions.
- The moving average convergence/divergence (MACD) histogram shows decreasing bearish momentum in the short-term.
Key Levels
- Resistance 3: $144.21
- Resistance 2: $141.84
- Resistance 1: $139.50
- Pivot Point: $137.12
- Support 1: $134.78
- Support 2: $132.40
- Support 3: $130.06
