- There is a technical pattern on the 1-hour chart that could be bullish.
- Ethereum didnt lose as much in value as BTC in the latest sell off.
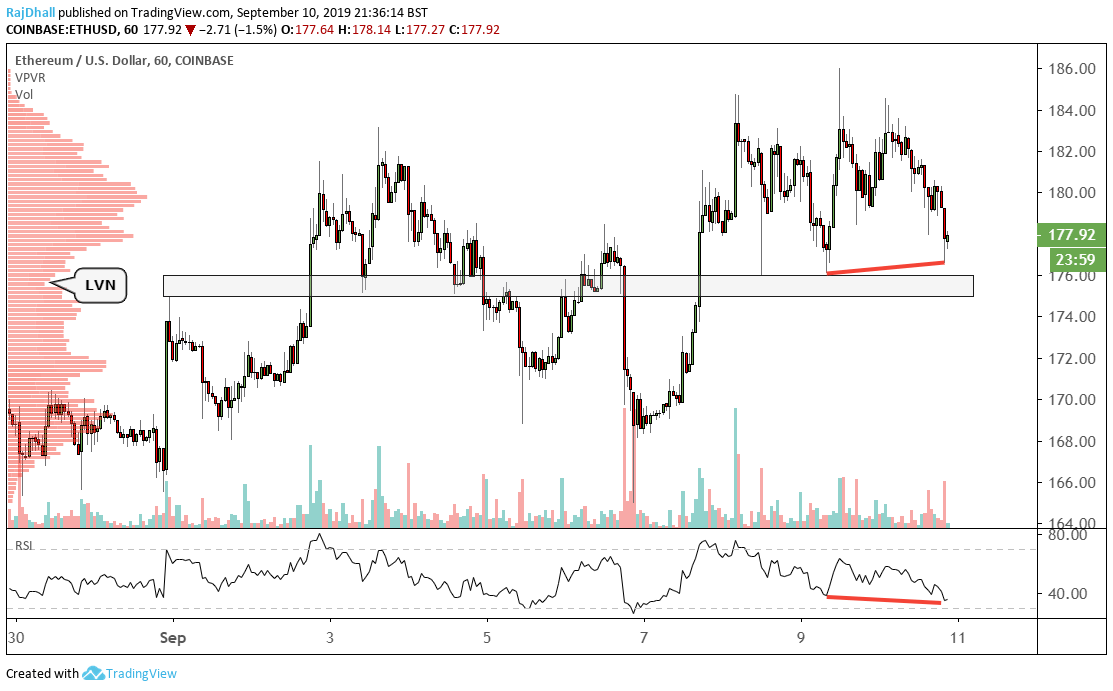
ETH/USD has a failure swing on the RSI marked by the red lines on the chart.
This is when the price makes a higher low but the indicate makes a lower low wave.
During the sell off when BTC/USD dropped below 10k, ETH/USD managed to hold up well.
There is also a massive support level to keep an eye on at 175.00.
This also matches up with a low volume node on the volume profile on the left hand side. This can indicate support in some instances.
The RSI has not hit the oversold level yet so there could be slightly more downside momentum to come but a rejection looks like it is taking place.
