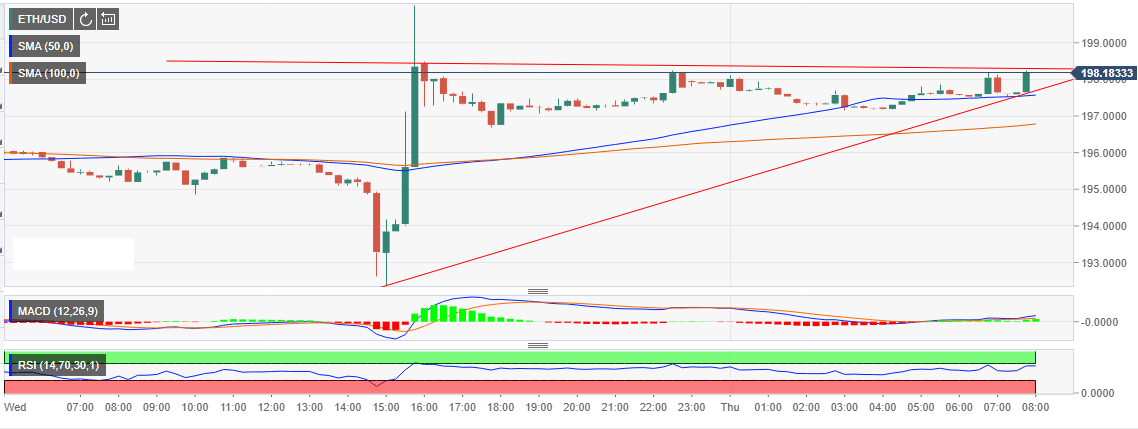
- Ethereum (ETH is down a subtle 0.04% on the day while hanging onto $197.
- The 50 SMA is offering support at $197.62 and the 100 SMA at $196.80.
It is yet another day in the red for the cryptocurrency market. Apart from light which is holding tight to the green line, all the other top ten digital assets are showing declines between 0.05% to 0.88%. Ethereum (ETH is down a subtle 0.04% on the day while hanging onto $197. In the analysis published by FXStreet yesterday, the asset had its upside limited at $196. As predicted, the price broke below the support at $195 only to find a support at $193.
The buyers reacted promptly to the drop ensuing an upswing in several engulfing candles. The price zoomed past the simple moving average resistance stepping above $198 before coming to an abrupt halt short of $199. Although the bears barricaded the path to $200, the buyers have managed to keep the price above $197.
The RSI at 64.00 is heading upwards, which is a significant buy signal. Moreover, the MACD has made it into the positive region (+0.12931); another solid buy signal. In addition, the short-term rising wedge pattern shows that a bullish breakout is around the corner. With this trend ETH/USD will retrace higher in the short-term to claim the broken support at $200. Meanwhile the 50 SMA is offering support at $197.62 and the 100 SMA currently at $196.80 (15-minutes).
ETH/USD 15-minutes chart