- ETH/USD is grinding higher amid market recovery.
- The ultimate resistance at $125.50 is still out of reach.
ETH/USD is changing hands at $123.44, gaining 2% in recent 24 hours. The price movement of the second largest coin has been influenced by speculative factors and the sentiments on a broad cryptocurrency market. Wild price gyrations at the end of the previous week gave way to quiet consolidation in new ranges.
However, considering the technical picture on a 1-day chart, ETH/USD and a potential to resume growth as long as it stays above $120.00.
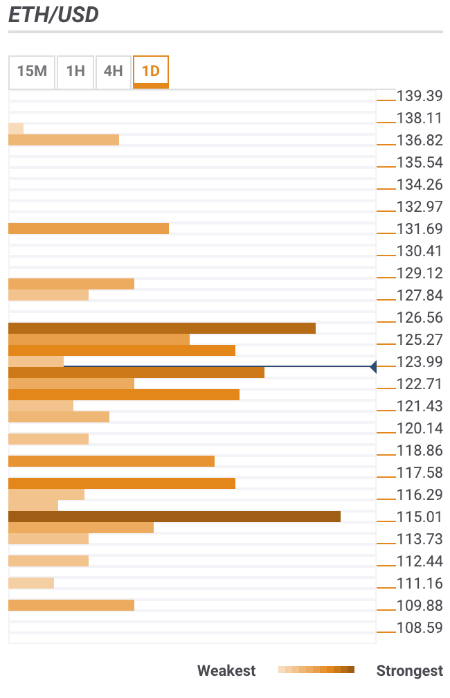
ETH/USD daily confluence detector
ETH/USD daily confluence detector reveals several support areas below the current price:
- $123.50 – Bollinger Band 1-hour Middle, host of SMA levels, Bollinger Band 15-min Middle, Previous Week high.
- $121.50-$121.70 – SMA50 1-hour, DMA5, SMA200 15-min, 38.2% Fibo retracement daily.
- $118.00 – 23.6% Fibo retracement weekly, Pivot Point 1-day, Support 1.
- $117.00-$116.70: Lower boundary of the Bollinger Band on 4-hour chart, 23.6% Fibo retracement monthly
- $115.00 – 38.2% Fibo retracement weekly, 161.8% Fibo projection daily.
On the upside, the resistance area starts from the current price level and goes all the way up towards $126.50. A sustainable move higher will clear all the way up towards psychological $130.00 strengthened by DMA100 and Pivot Point 1-day Resistance 2.
However, before we get there, we will have to clear $124.30 (Bollinger Band 4-hour Upper, 61.8% Fibo retracement daily, previous week high) and $125.50 – DMA50, 38.2% Fibo retracement monthly.
ETH/USD, 1D chart