- ETH/USD recovery stopped at $110.00.
- The way to the downside packed with support levels.
ETH/USD tested area above $110.00 during early European hours. However, the coin failed to settle above the said psychological area and retreated towards $108.30 by the time of writing.
While the coin managed to clear several important technical levels, the upside looks unconvincing at this stage, as the growth was triggered by speculative factors and may be reversed soon.
However, if ETH/USD manages to settle above $110.00 handle, the technical picture will be improved.
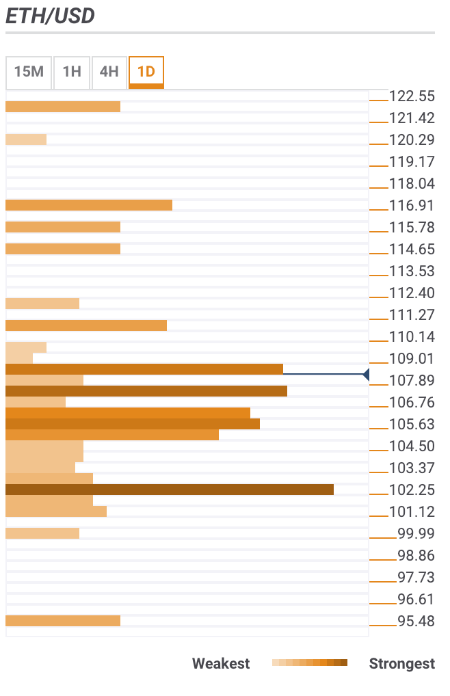
ETH/USD daily confluence detector
ETH/USD daily confluence detector reveals numerous support areas below the current price:
- $107.70-$108.00 – this is a tough hurdle created by DMA10, SMA5 1-hour, 38.2% Fibo retracement weekly and the highest level of the previous day.
- $105.50-60 – SMA100 15-min, SMA10 4-hour, 23.6% Fibo retracement weekly, 61.8% Fibo retracement weekly, SMA100 1-hour.
- $104.70 – SMA50 1-hour, SMA200 15-min, 38.2% Fibo retracement daily, the lower boundary of Bollinger Ban on 4-hour chart.
- $102.00 – psychological level strengthened by the lower boundary of Bollinger Band on a 4-hour chart, the lowest level of the previous week and the previous month.
On the upside, there are three resistance areas:
- $109.00 – the upper boundary of Bollinger Band 4-hour and 1-hour, SMA10 15-min, previous low 1-hour
- $110.00-110.50: 61.8% Fibo retracement weekly, previous high 4-hour.
- $117.00 – 23.6% Fibo retracement monthly.
BTC/USD, 1D