- ETH/USD ha stuck on approach to strong resistance area.
- A sustainable move above $108.00 is needed to improve the technical picture.
ETH/USD is rangebound marginally below $105.00 handle. The third largest coin with a market value of $10.9B has lost 0.4% of its value since this time on Thursday. The cryptocurrency market has calmed down after a volatile start of the week, so has Ethereum. It has recovered from the recent lows at $101.12, but the upside momentum failed to gain traction.
From the intraday perspective, ETH/USD is moving within a triangle. Its upper boundary at $105.16 reinforces the resistance area around $105.00. Once it is cleared, the price may recover towards $105.37 (SMA100 1-hour) and $106.50 (SMA200 4-hour).
Meanwhile, the ultimate short-term target lies with the recent congestion zone $108.00. It needs to be broken for the recovery to gain traction and open up the way towards psychological $110.00.
On the downside, the initial support is produced by SMA50 (1-hour) at $104.23 and the lower border of the above-mentioned triangle at $103.67. Once below, the sell-off will gather pace with the next aim at $102.00 and the recent low of $101.12.
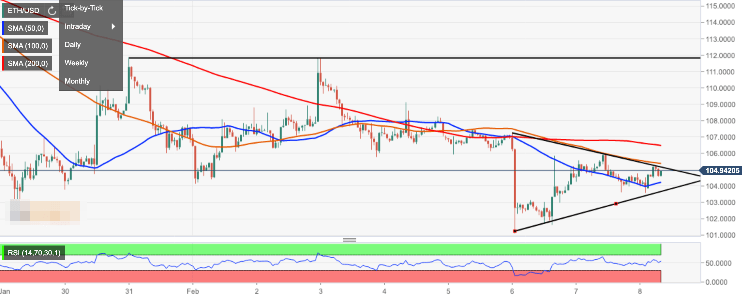
The intraday Relative Strength Index points upwards, implying that further recovery is possible. However, as a cluster of strong resistance areas may discourage bulls for the time being.
ETH/USD, 1-hour chart