- ETC/USD extends Saturday’s bounce amid fresh bid-wave.
- The coin charts symmetrical triangle breakout on hourly sticks.
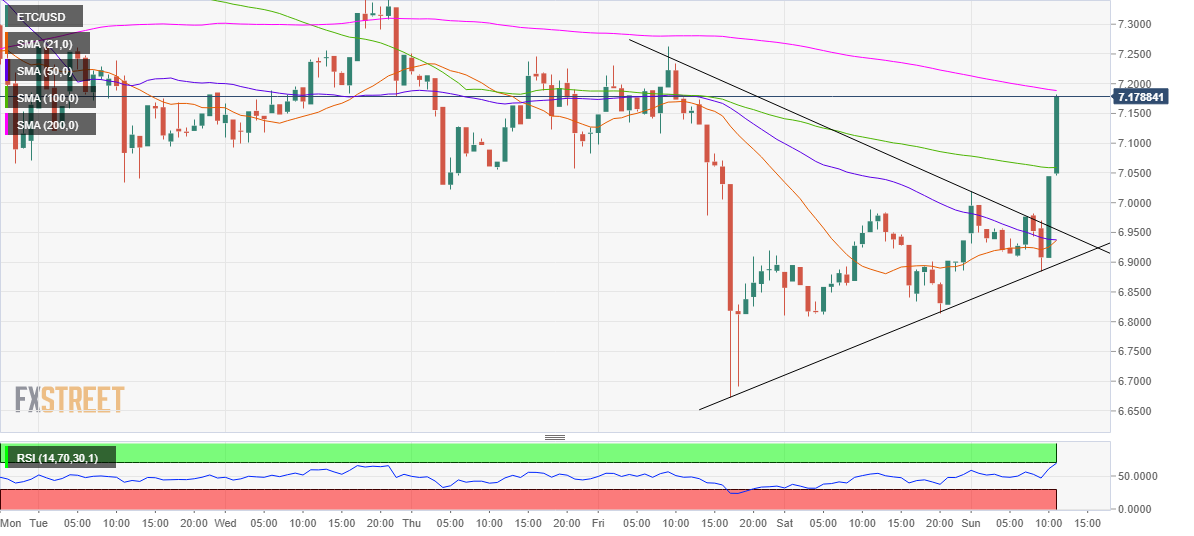
- 200-HMA offers immediate resistance after the sharp pullback.
The pullback in Ethereum Classic (ETC/USD) from $6.8844 appears to have gathered steam this Sunday, as the coin sees a rapid rise to the intraday highs above $7.15.
The price picked-up bids right after the bulls took out the powerful resistance at $6.93, the convergence of the 21 and 50-hourly Simple Moving Averages (HMAs).
The sharp rally, however, came on the back of the symmetrical triangle breakout on the hourly chart above the key resistance at $6.9606.
The hourly Relative Strength Index (RSI) spiked towards the overbought region, now trading near 69.0.
On its relentless rise, the ETC bulls ripped through the bearish 100-HMA at $7.0586. The further upside now remains capped by the horizontal 200-HMA at $7.1885.
A break above which the $7.20 level will be tested. The August 7 high of $7.2618 could be next on the buyers’ radar.
If the bulls face rejection at the 200-HMA barrier, the price could drop back towards the resistance-turned-support at 100-HMA.
The next support is aligned at the falling trendline (pattern) resistance now support at $6.9548.
ETC/USD: Hourly chart
ETC/USD: Additional levels to consider
