Home Ethereum Classic Price Analysis: ETC/USD bulls fail near the $7-level
Crypto News

Ethereum Classic Price Analysis: ETC/USD bulls fail near the $7-level

  • ETC/USD bulls ran out of style near the SMA 200 curve.
  • MACD shows sustained bearish momentum.

ETC/USD daily chart

ETC/USD daily chart

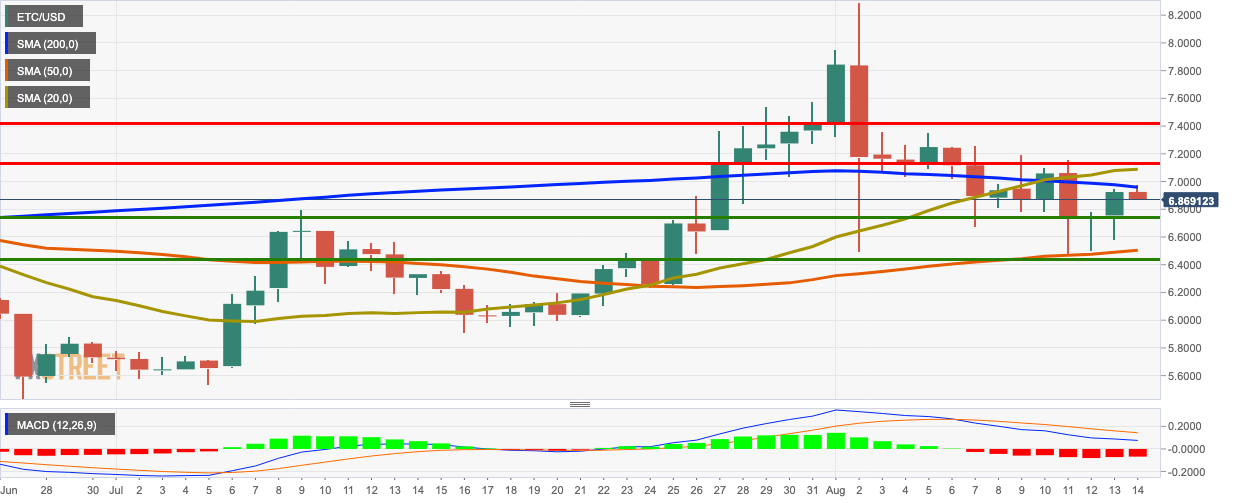
ETC/USD faced bearish correction following two straight bullish sessions. The price dropped from $6.925 to $6.889. The moving average convergence/divergence (MACD) shows sustained bearish market momentum. 

There are four strong resistance levels at $6.96 (SMA 200), $7.09 (SMA 20), $7.143 and $7.41. On the downside, we have three healthy support levels at $6.75, $6.515 (SMA 50) and $6.45.
 

FX Street

FX Street

FXStreet is the leading independent portal dedicated to the Foreign Exchange (Forex) market. It was launched in 2000 and the portal has always been proud of their unyielding commitment to provide objective and unbiased information, to enable their users to take better and more confident decisions.