- ETC/USD went up from $6.88 to $7.11 in just 15 mins this Thursday.
- Currently, ETC/USD is trading for $7.07.
ETC/USD has experienced an extremely bullish Thursday so far. The price of the asset spiked by 3.34%, going from $6.88 to $7.11 in just 15 mins. Since then, the price has settled around $7.07. The last time ETC/USD traded this high was a week ago on 28th August. The 15-mins chart also shows us that the bulls and bears are currently engaged in a tug of war, so more movement can be expected. As earlier reported, the social Media dApp iZbreaker announced its collaboration with Ethereum Classic.
ETC/USD hourly chart
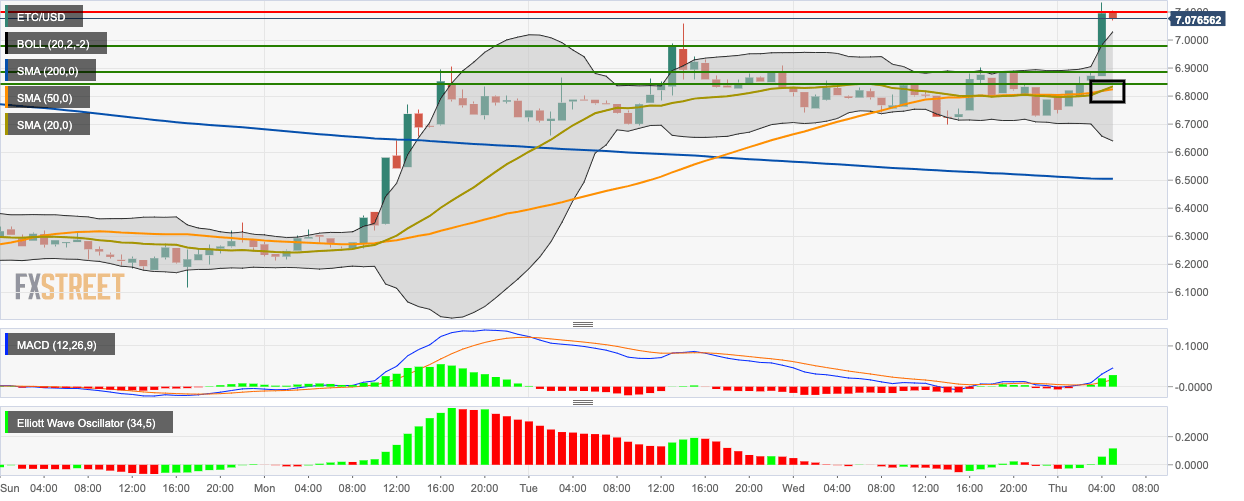
The second last price session in the hourly chart has gone above the upper jaw of the 20-day Bollinger band, indicating that the price is currently overvalued. Since then, the price has met resistance and gone down slightly. The 20-day simple moving average (SMA 20) curve has crossed over the SMA 50 curve along with the price spike, which is a bullish sign. The moving average convergence/divergence (MACD) indicator shows increasing bullish momentum while the Elliott oscillator has had five straight bullish sessions.
