- ETC/USD went up from $6.15 to $7.22 this Thursday.
- The 200-day simple moving average (SMA 200) crossed over the SMA 50 curve.
ETC/USD daily chart
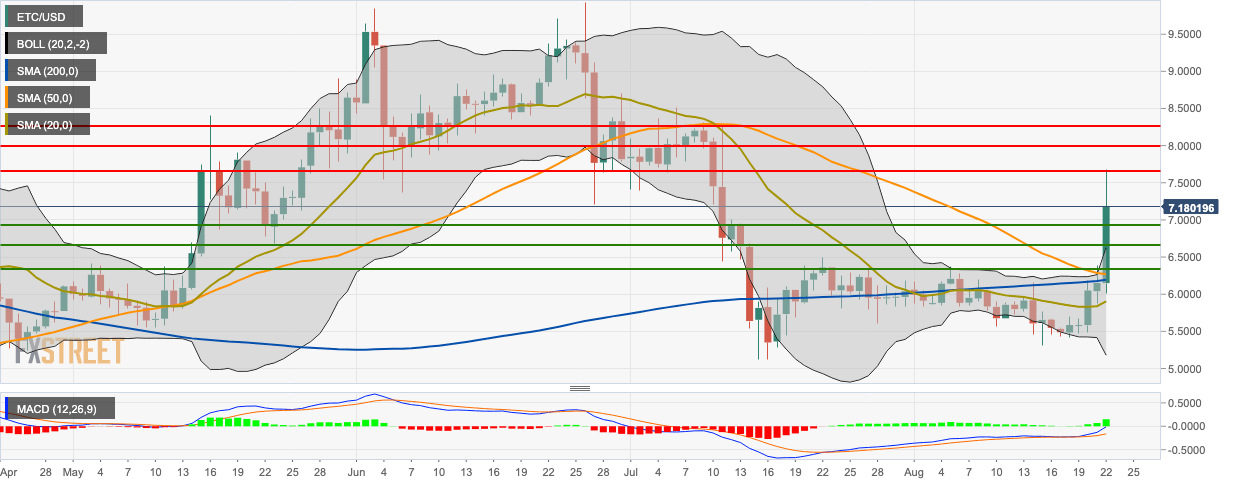
Ethereum Classic has strung together three bullish days in a row. This Thursday has been extremely bullish, wherein the price has gone up from $6.15 to $7.22 this Thursday. The 200-day simple moving average (SMA 200) crossed over the SMA 50 curve, which is a potentially bearish sign. The price is trending above the SMA 200, SMA 50 and SMA 20 curves. The moving average convergence/divergence (MACD) shows increasing bullish momentum.
ETC/USD 4-hour chart
-637021100669171724.png)
The 4-hour ETC/USD has gone above the upper curve of the 20-day Bollinger band, indicating that the price was overvalued. The price found resistance at $7.31 and then fell to $7.22. The Eliott oscillator shows five straight bullish sessions with increasing intensity. The 20-day simple moving average (SMA 20) has crossed over the SMA 50 and SMA 200 curves. The price is also trending above the three curves.
ETC/USD hourly chart
-637021100334314949.png)
The hourly ETHC/USD price is trending in a downward channel formation. The hourly chart is also trending above the red Ichimoku cloud. The hourly price went up to $7.56, where it met resistance and then fell. The relative strength index (RSI) indicator is trending around 70.30 in the overbought zone.
Key Levels
