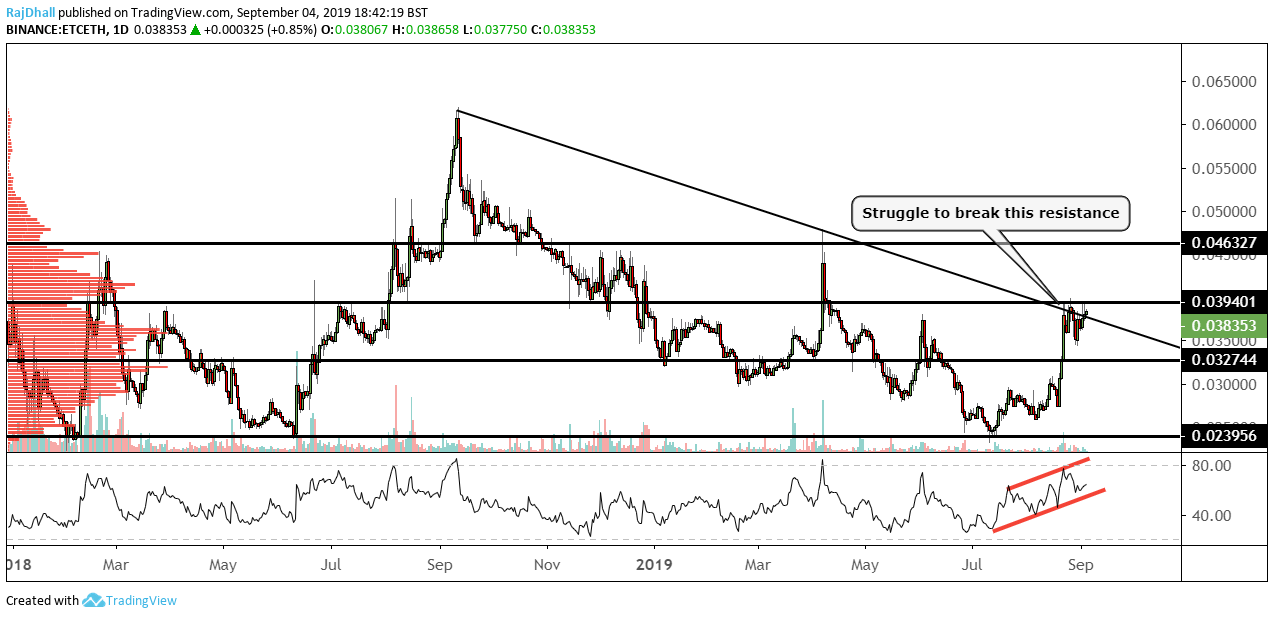
- ETC/ETH is up 1.5% on the session and the price has stalled ahead of the 0.0400 psychological level.
- There is a key resistance level and trendline halting moves higher at the moment.
- On the daily candlestick chart there has been two rejections of higher levels.
ETC/ETH looks to have stalled on the daily chart above. There was a key trendline that price broke indicating more upside movement but since the move has not really materialized.
The 0.03940 level looked like a pretty strong resistance level in any case but after the momentum seen yesterday, you would be forgiven if you thought it would have continued.
Now on the downside, there are two scenarios in focus. One is the retest of the trendline at a lower level and a move back up. The second would be a move lower to test the 0.03274 support level.
Looking at the RSI now there is a pattern that looks vulnerable to a downside break. This could suggest we are in need of a retracement as the momentum indicator is showing signs of a slowdown.
0.0400 has not been tested either yet and maybe that is the reason for the price stalling at these areas.
Lastly, today the price is 1.5% higher so let’s see what happens for the rest of the session and also wait for the Asian traders to step in.

