- A move above $195.80 is needed to mitigate the bearish pressure.
- The significant support is created by a confluence of technical indicators below $186.00.
The second-largest cryptocurrency with the current market capitalization of $20.6 has recovered from Sunday’s low of $182.96 and hit the intraday high at $194.20 during early Asian hours. The coin has gained nearly 3% on Monday and stayed unchanged on a day-on-day basis. At the time of writing, ETH/USD is hovering marginally above $191.00
Ethereum’s technical picture
Looking technically, a sustainable move above $190.00 bodes well for ETH bulls. This area strengthened by SMA100 (Simple Moving Average) on a 1-hour chart serves as an initial support level that might slow down the downside correction from the intraday high. However, a sustainable move below this handle will open up the way towards $189.40 (SMA50 1-hour) and $188.90 (the middle line of 1-hour Bollinger Band). Critical support lies with $185.60 (the lower line of 4-hour Bollinger Band). Once below, the sell-off may gain traction with the next focus on the recent low of $182.96.
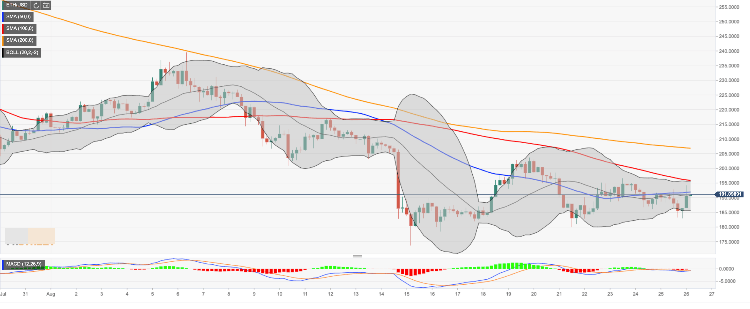
On the upside, the initial resistance is created by a confluence SMA50 4-hour and SMA200 1-hour on approach to psychological $192.00. We will need to see a sustainable move above this zone for the upside to gain traction. The next resistance is created by the upper line of the 4-hour Bollinger Band and SMA100 4-hour at $195.80.
ETH/USD, 4-hour chart