- The Ethereum (ETH) price is trading very marginally within negative territory on Friday, down some 0.4%.
- ETH/USD is moving within a descending channel pattern formation.This could be back firmly below $200 before any committed move back north.
- Support to the downside is currently seen at just below the $200 mark at $199. Resistance seen at the upper TL at $206.
- A breach south could send ETH/USD falling down to $186 (11 Oct low). Bulls breaking out could gun for $215 supply area and enough momentum could take it back up to $230.
ETH/USD 60-minute chart
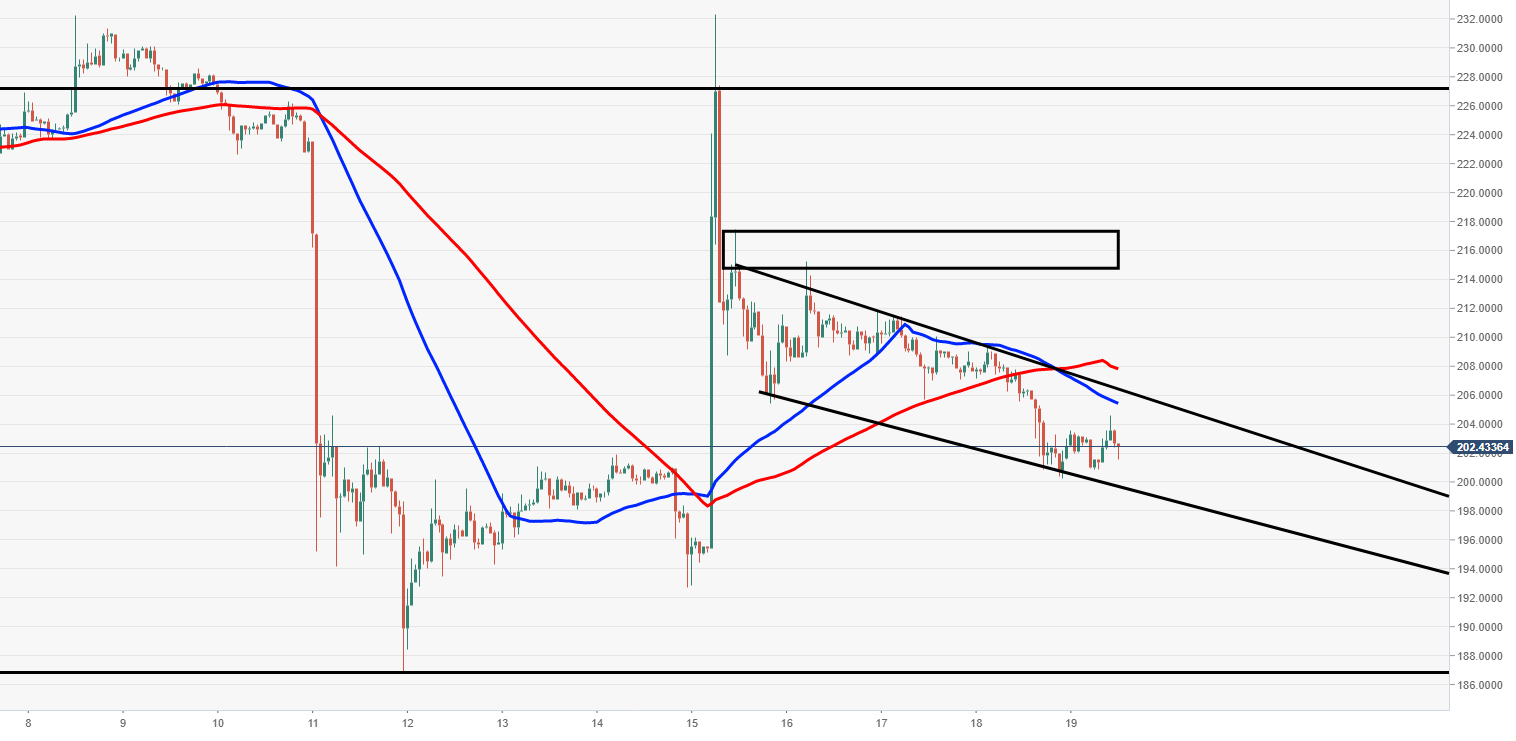
Spot rate: 202.52
Relative change: -0.41%
High: 204.62
Low: 200.89
Trend: Bearish/Neutral
Support 1: 199.80, lower supporting trend line.
Support 2: 192.75, 15 October low.
Support 3: 186.50, demand area & 11 October low.
Resistance 1: 205.38, 50MA (60-minute).
Resistance 2: 206.56, upper trend line of channel.
Resistance 3: 208.00, 100MA (60-minute).
