- Ethereum price resumed the decline after a failed attempt to reach $200.00.
- Сritical support is created by psychological $170.00.
ETH created the recent top at $197.80 on October 11 and has been sliding down ever since. The second-largest digital asset retreated below $180.00 during early Asian hours amid the sell-off on the cryptocurrency market. This development has worsened the technical picture and made the coin vulnerable to further losses. Ethereum’s market value is registered at $19.4. The coin is down 2.7% on a day-on-day basis.
Ethereum’s technical picture
On the daily charts, ETH/USD dived under SMA50 (Simple Moving Average) and the middle line of the Bollinger Band at $179.50. As the bearish momentum gains traction, the next important support $170.00 comes into focus. Once it is out of the way, the downside is likely to gain traction and take the price to $168.30. This support coincides with the lower boundary of the recent consolidation channel and separate us from an extended decline towards $167.70 ( the lower line of the daily Bollinger Band) followed by the recent bottom at $152.50.
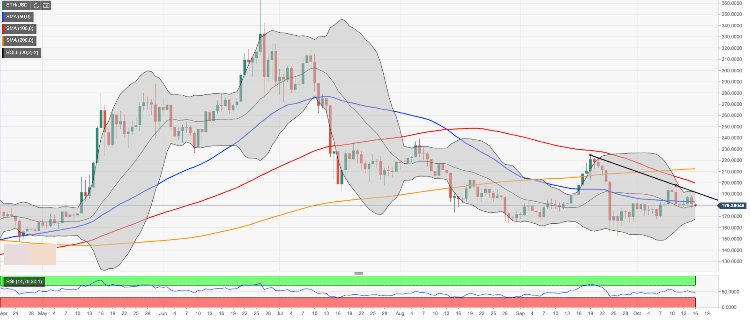
On the upside, we will need to see a sustainable move SMA50 daily at $182.90 for the upside to gain traction. The next strong resistance is created at $191.50 by a combination of the upper line of the daily Bollinger Band and a bearish trendline from the recent top $197.80.
ETH/USD, the daily chart