- Ethereum drops 2.5%; defends $110 short-term support.
- Technical indicators are motionless: sideways trading to continue.
Ethereum has been range-bound for the last one week following the overpowering drop in November. There was an extended decline that tested $100 but fortunately a bounce occurred with the price making it above $110. Ethereum price plunged 48.63% in November and appears to have found a bottom around $100.
The crypto has opened the trading this week with declines amounting to 2.5% on Monday. The asset is dancing with $113 with the upside immediately limited by the 50 SMA. The initial resistance is highlighted at $120 while the supply zone at $130 (100 SMA) will limit the gains heading towards $140 (seller concentration).
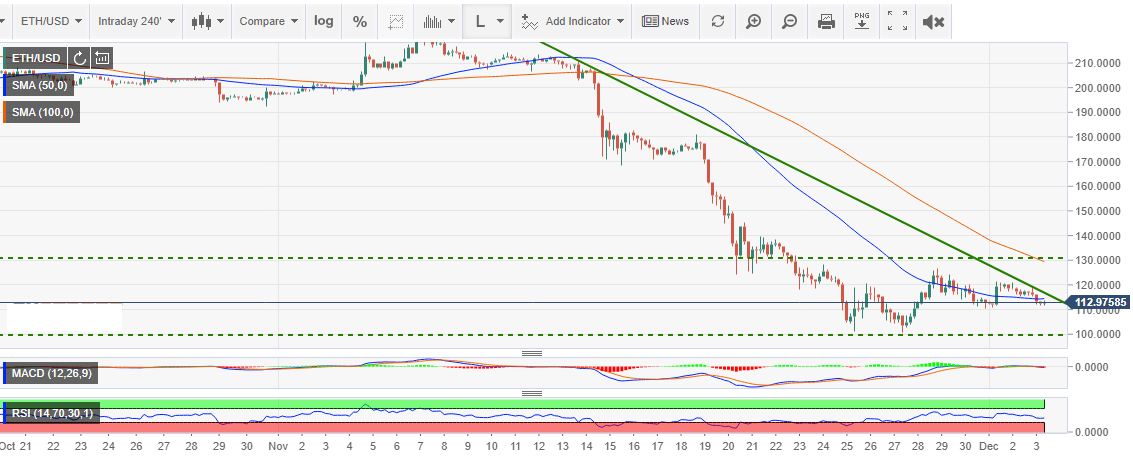
In the meantime, the first support for Ethereum is at $110 while the next support target lies at $100. The RSI is horizontal above 42% while the MACD is motionless at the mean level (0.0). This means that the price is likely to continue with the sideways trading in the short-term. The buyers are present but lack the momentum and boost to support upside movements. A correction above $120 could see the buyers focus on the psychological $120.
ETH/USD 240-minutes chart