- Expect stability towards the end of the week as seen during last week.
- A bullish momentum continues to build above the 38.2% Fibonacci level.
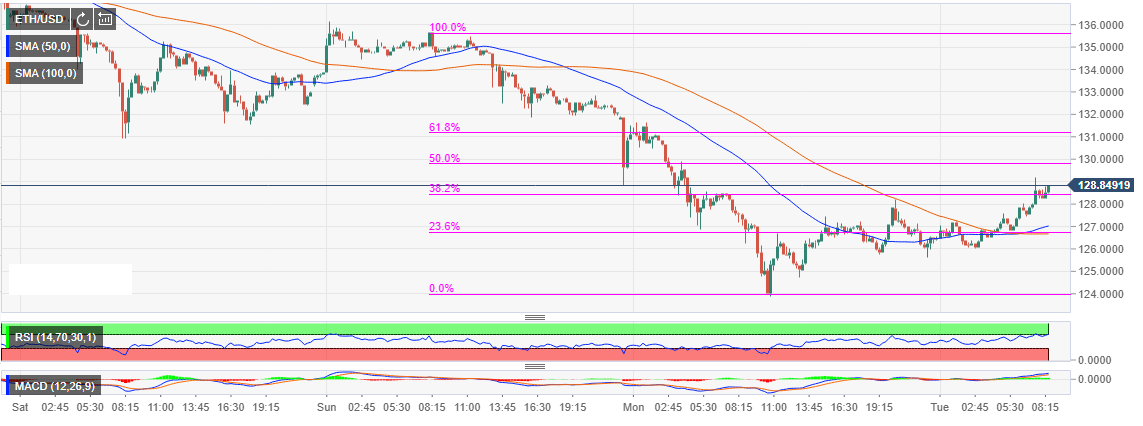
The market is returning in the green after the brief crash on Monday. It is becoming a trend for cryptocurrencies to begin the week’s trading in declines. We expect stability towards the end of the week as seen during last week. Ethereum closed the week trading slightly above $130 close to the 61.8% Fib retracement level between the last swing high of $135.62 and a swing low of $123.99.
The bearish trend on Monday saw Ethereum correct further to the south breaking below the support at $130 and $125. The bulls, keen to prevent decline below $120, drew a line in the sand at $124. There has been an upside correction above $125 and the Simple Moving Averages (both the 50-day SMA and the 100-day SMA).
A bullish momentum continues to build above the 38.2% Fibonacci level. According to the Relative Strength Index (RSI), Ethereum price is likely to break above the resistance at $130 with the buyers’ eyes set on $140.
Ethereum recently experienced a hard fork upgrade referred to as Constantinople. The upgrade was the third stage in the network’s four-stage roadmap. The next stage is the Ethereum 2.0 or otherwise referred to as Serenity. It will Ethereum transition from the Proof of Work (PoW) to a Proof of Stake (PoS) consensus algorithm among other features.
ETH/USD 15-minutes chart