- ETH/USD went up from $218.55 to $220.60.
- The Relative Strength Index (RSI) indicator is trending in the overbought zone.
ETH/USD had a bullish start to Saturday following a bearish Friday. So far, the price has gone up from $218.55 to $220.60. The hourly breakdown shows us that ETH/USD had fallen to $214.85 this Thursday, where it found support. Ever since then, the bulls then were able to rally together and spike the price up to $220.60 in just three hours. Looking at the chart, ETH/USD is currently consolidating in a flag formation, getting primed for a breakout.
ETH/USD daily chart
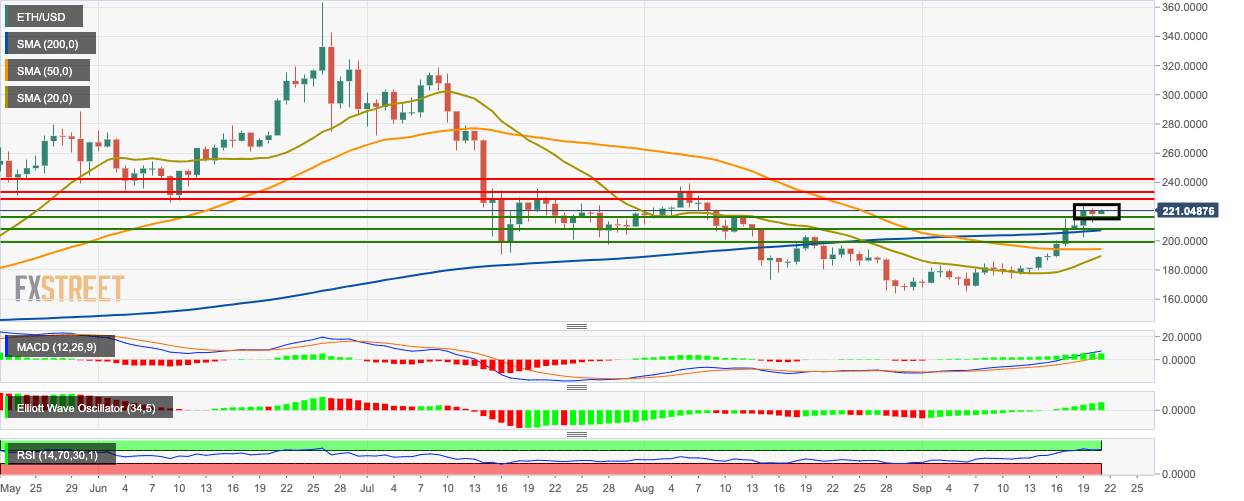
The price is trending above the 200-day Simple Moving Average (SMA 200), SMA 50 and SMA 20 curves. SMA 20 is looking to cross over with the SMA 50, which is a bullish signal. The Moving Average Convergence/Divergence (MACD) indicator shows increasing bullish momentum, while the Elliott Oscillator shows 20 straight bullish sessions of growing intensity. The Relative Strength Index (RSI) indicator is trending within the overbought zone.
