- Ethereum stuck in a parallel channel.
- Momentum suggests some more downside left.
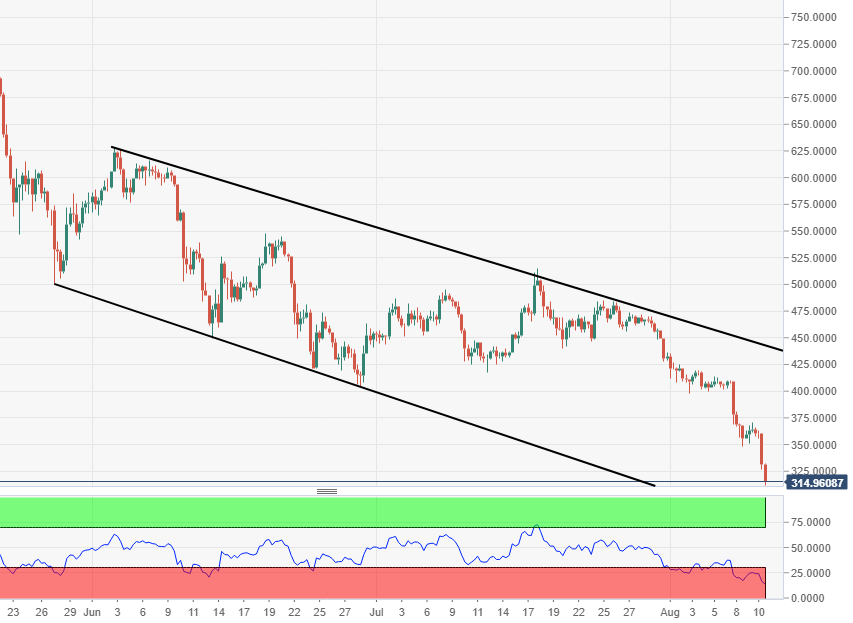
Ethereum, the second largest cryptocurrency by market capitalisation, is stuck in a downward sloping parallel channel on the medium term charts and is headed down all the way to more than eight months low.
ETH/USD is lower by nearly 5 percent at $314.92 just at the low point of the day with heightened volatility in the weekend trading. On the 480-minute chart, Ethereum is stuck in lower high, lower low downward sloping parallel channel.
Given the momentum, the crypto is headed towards sub-$300 levels, last seen in Novemember 2017 and chances are it may still head lower towards $270-80 zone where lies some support for the crypto.
ETH/USD 480-minute chart: