- Ethereum price explores levels downstream as losses to $1,600 beckon.
- The MACD and the RSI indicators add credence to the bearish narrative.
- Support at $1,800 must hold if bulls desire to reverse ETH’s bearish leg.
Ethereum’s upward recovery hit a snag on approaching $2,400. Analysts had predicted that the Ethereum price would hit levels around $5, 000 before June 30, 2021. However, the bloodbath that the cyrptomarket has experienced since May has delayed the uptrend.
Meanwhile, ETH has declined tremendously downward, shedding over 57% from its all-time high of $4,356 achieved in May. Support is expected around the $1,700 zone, but the bearish leg has the potential to stretch to areas below the $1,600 zone.
Ethereum’s Downtrend Set to Continue
The daily chart highlights a fading bullish technical outlook. However, bears seem to have tightened their grip, with more losses in the offing. For example, the Moving Average Convergence Divergence (MACD) indicator Ethereum’s trend tending south.
This momentum oscillator is commonly used in trading trends. However, its use in identifying overbought and oversold conditions is rare. The indicator overlays on a chart with two trendlines oscillating with no boundaries.
The cross-over of the two trendlines send a trading signal similar to that of the moving average technical tool. Note that when the MADC line (blue) crosses over the zero line (midline), it sends a bullish signal and sends a bearish signal when it crosses below the midline. Moreover, when the MACD line (blue) crosses the signal line (orange), the trend is bullish. Other other hand when the MACD crosses below the signal line, the trend is bearish as shown on ETC’s daily chart.
Note that as the MACD moves further into the negative zone, it is expected that Ethereum’s bearish momentum will increase. If this happens, it will trigger more sell orders. If you want to buy some ETH check out this How To Buy Cryptocurrency guide for details.
Ethereum Price (ETH/USD) Daily Chart
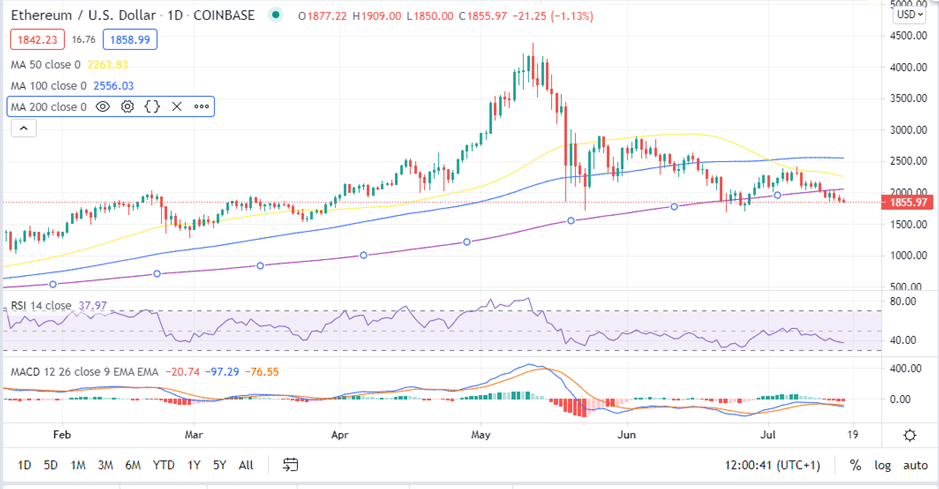
Similarly, the Relative Strength Index (RSI) adds credence to this bearish narrative as it approaches the oversold zone. The sustained movement of the RSI towards the oversold region shows that Ethereum price bears are stronger, and that the downtrend may continue during the next trading sessions.
Ethereum Could Reach These Levels
At the time of writing ETH teeters around $1,855 as bulls fight for support at $1,800. A daily closure below this level will put pressure on the next support level at around $1700. Note that in April Ethereum price tested support at $1500 before recovering to reach record highs in May. A similar action could be seen before ETH price makes a significant recovery.
A daily closure above the $1,800 support level will bolster ETH buyers to focus on the uptrend while driving all the efforts into pushing the Ethereum price above $2,000 an area defined by the 200-day SMA. This move my begin an important recovery face and set the rise for gains above $2,400.
- Check our guide to know the most credible crypto brokers in the market.
Looking to buy or trade Ethereum now? Invest at eToro!
Capital at risk
