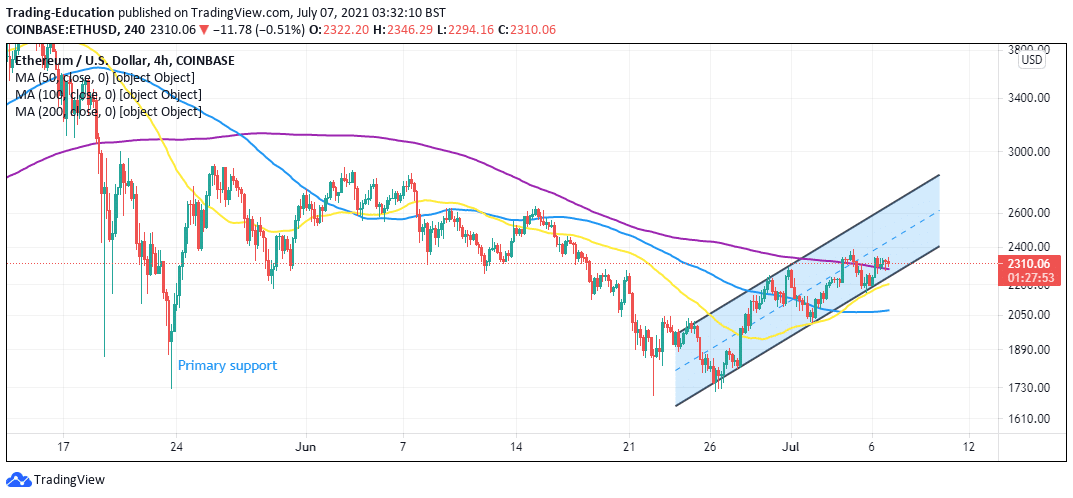
- Ethereum price holds above the 200 SMA after failing to break the hurdle at $2,400.
- Bulls must break the resistance at the ascending channel’s middle boundary to sustain the uptrend.
- An uptick in network growth could help sustain the anticipated uptrend to $3,000.
Ethereum price uptrend continues despite the many hurdles. Recently, the barrier at $2,400 was tested but not broken. The gigantic smart contract retreated, although briefly toward $2,300, whereby the 200 Simple Moving Average (SMA) provided the much-needed support.
Meanwhile, Ethereum is dancing within the confines of an ascending parallel channel. The uptrend will remain intact as long as the lower boundary holds in spite of the frequent battering from the bears. Moreover, holding above the mentioned support at the 200 SMA will release a lot of pressure from the channel.
ETH/USD four-hour chart bullish impulse
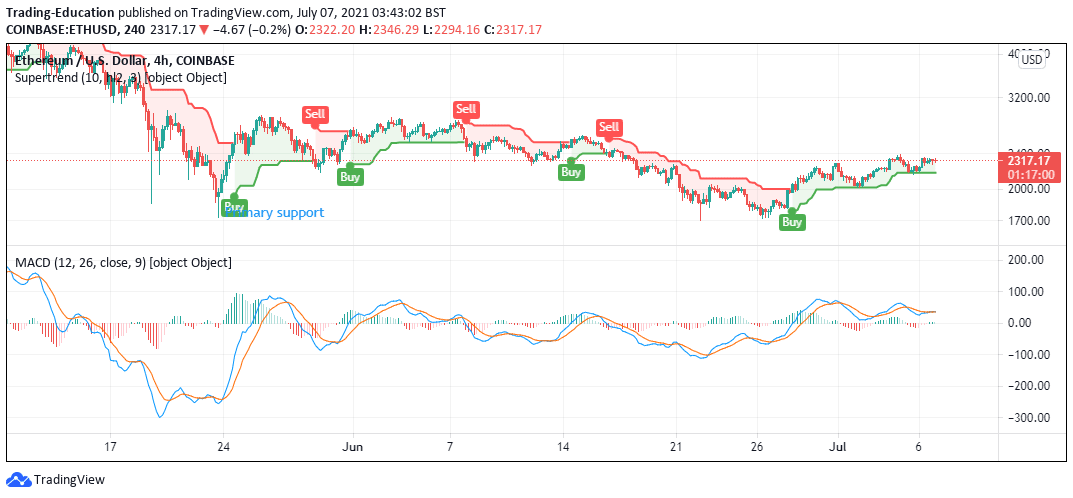
What Is Desired For Ethereum Price To Lift To $3,000?
The Moving Average Convergence Divergence (MACD) indicator may flip bullish in the coming sessions. This call to sell will appear as the 12-day Exponential Moving Average (SMA) crosses above the 26-day EMA. In addition to that, the MACD must sustain its position in the positive region and keep trending upward.
Another buy signal emanates from the SuperTrend indicator in the exact timeframe. This technical tool is a chart overlay like the moving averages. However, the SuperTrend considers the volatility using the average true system.
When the signal line closes the day below Ethereum, a buy signal appears while changing from red to green. Realize that the signal can also be bearish if the SuperTrend closes the under the asset’s price while flipping from green to red. If the prevailing buy signal holds, we expect Ether to close the gap to $3,000 gradually.
Ethereum price chart flashes key buy signals
According to Santiment, an uptick in network growth suggests that Ethereum’s fundamentals catch up with the up-trending price. The network growth model tracks the number of new addresses created on the network each day and critical when learning how to buy cryptocurrency.
Ethereum network growth recovers
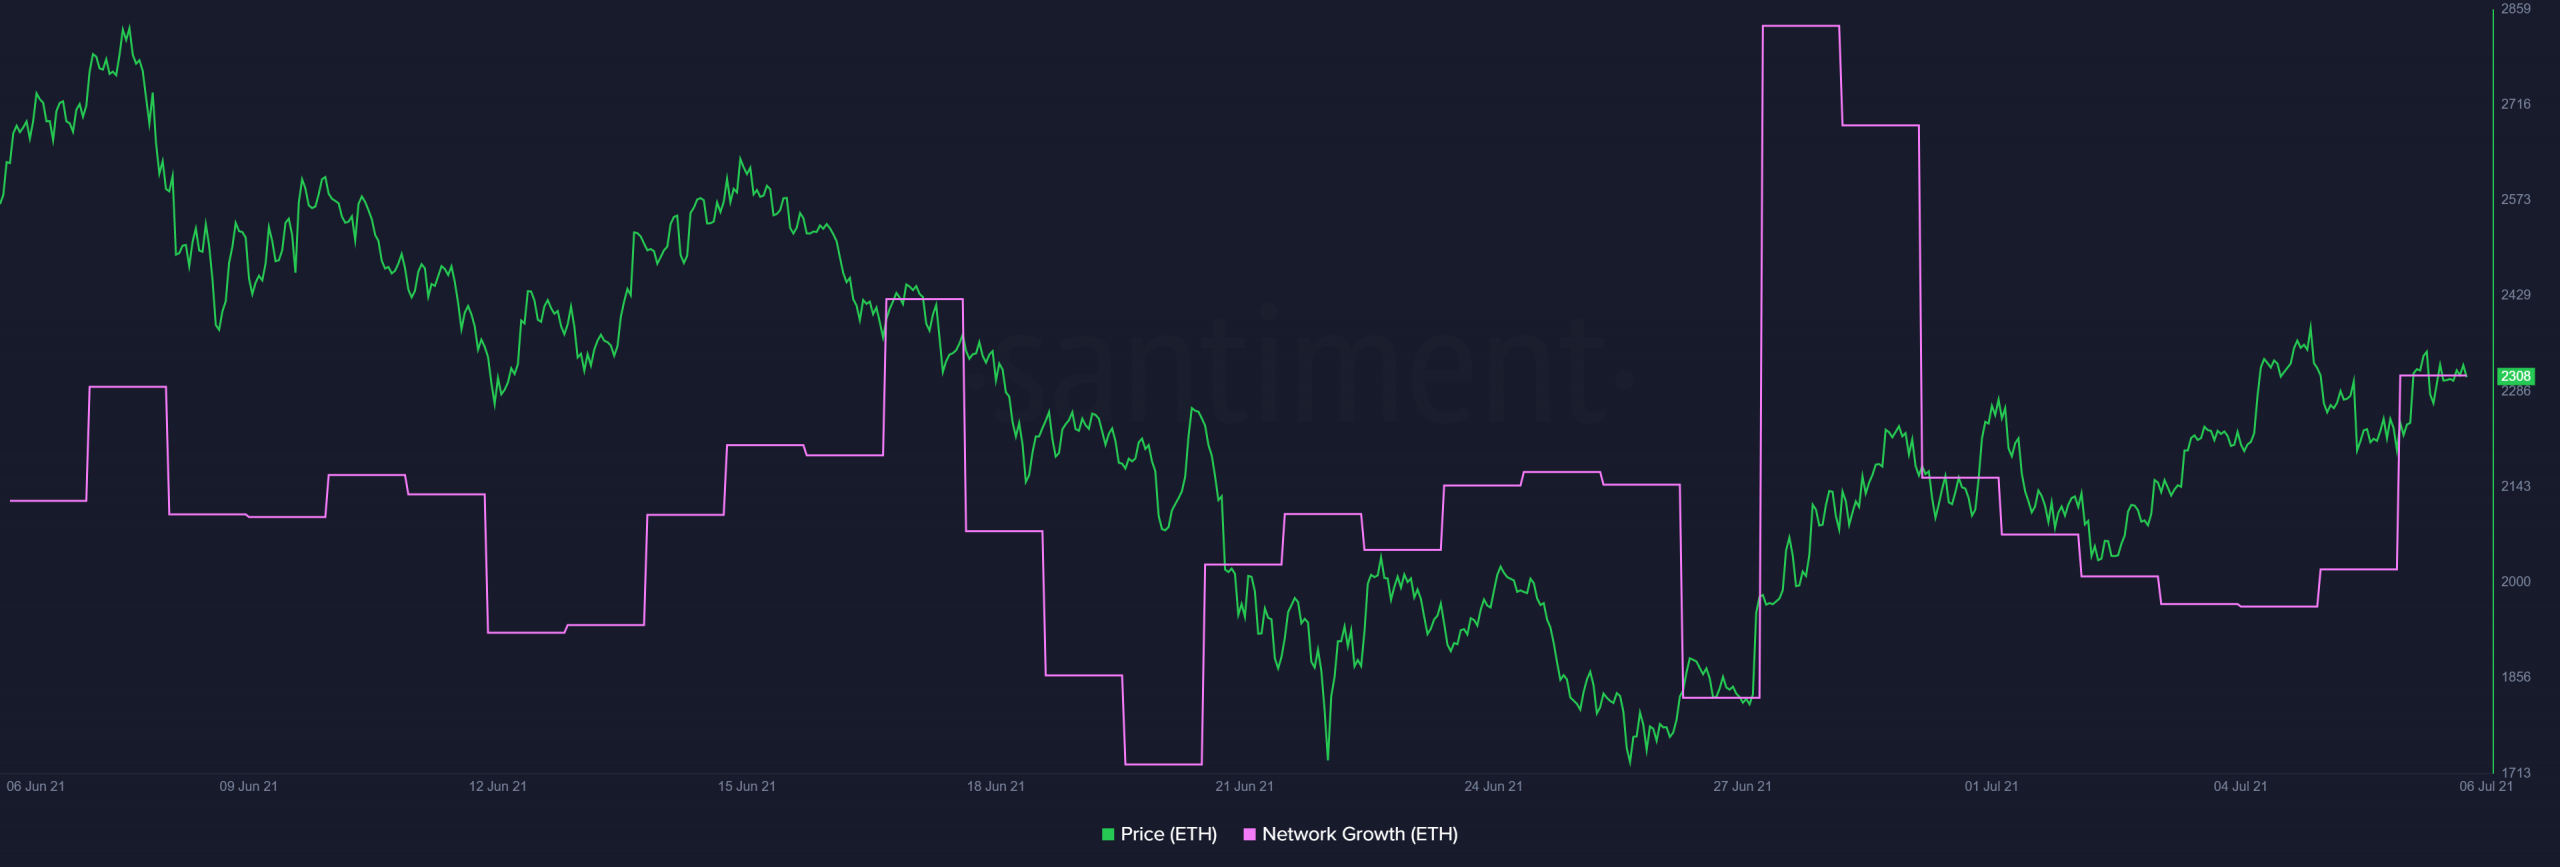
Around 103,000 addresses joined the ETH network on July 6, up from roughly 84,700 reported on July 4. If the uptrend continues, Ethereum will continue to gain ground. Note that this fundamental reveals whether the Ethereum network is gaining traction or not.
Decreasing network growth is regarded as bearish because it negatively impacts the adoption of the project. Besides, Ether’s network activity will be reduced significantly, affecting the level of investor speculation.
Capital at risk