- ETH eyes $305 following rejection at the downward trending line.
- ETH whales and long-term investors remain optimistic despite bearish price action.
After failing to break above the downward trending line this Monday, ETH bulls completely lost their momentum. The bears duly took over, dropping the price by ~$.4.65% as ETH fell from $354 to $338.58. In the process, the second-largest coin by market cap fell below the 100-day SMA. As defined by the TD Sequential Indicator, the support level to watch out for lies at $305.
ETH/USD daily chart
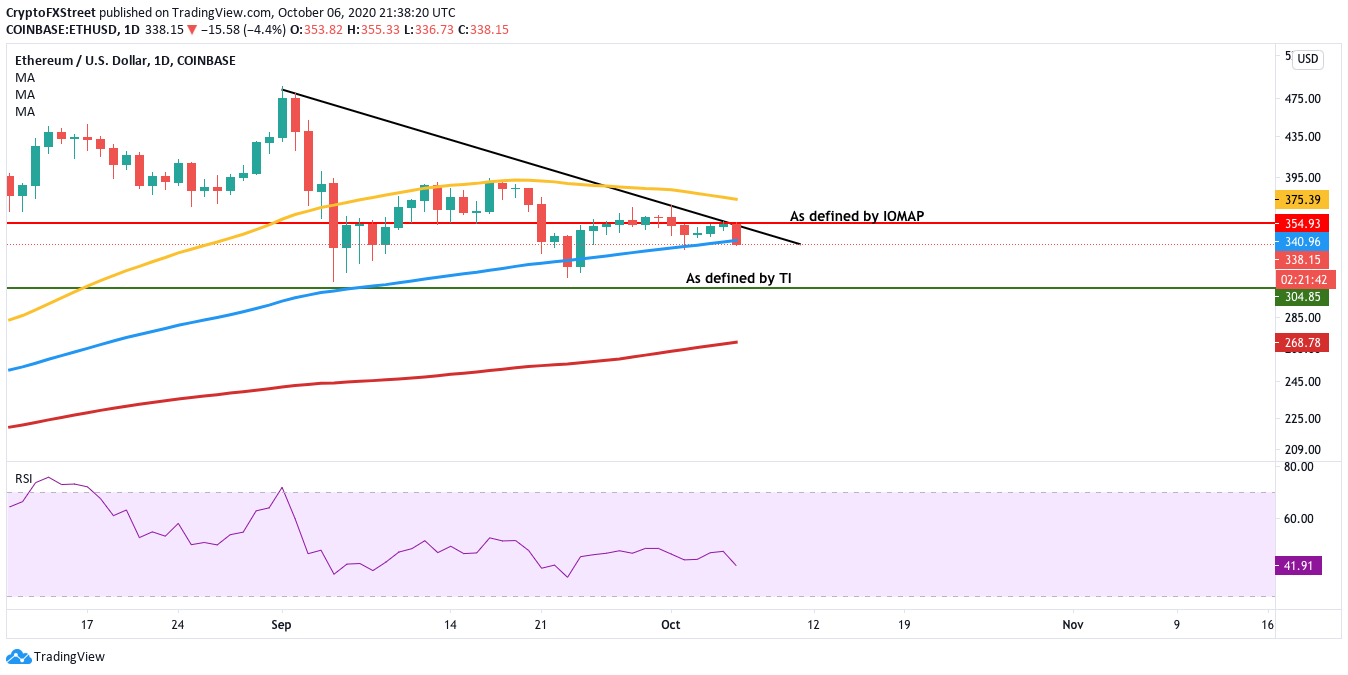
If the price breaks below this level, it could be utterly catastrophic for the buyers as the next viable support lies at the SMA 200 (~$270). If the ETH bulls attempt a comeback, their upside potential is limited by the downward trending line. If they somehow manage to break above that, the IOMAP shows a solid resistance line at $355.
ETH IOMAP
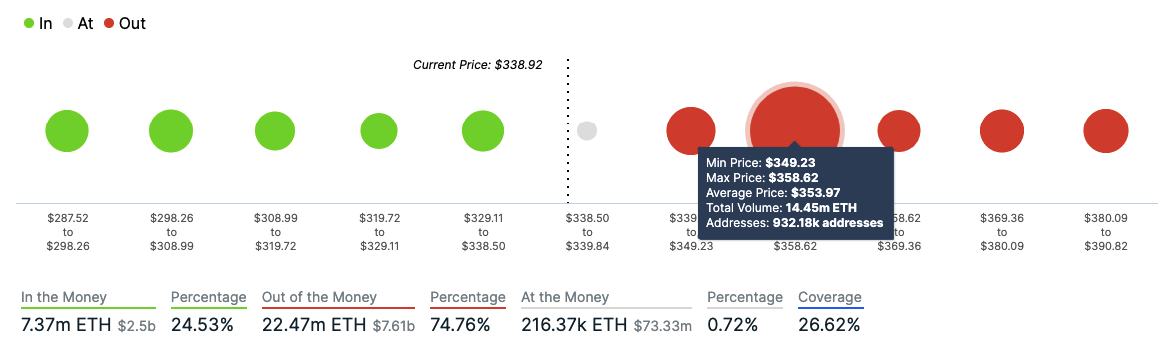
The IOMAP or “In/Out of the Money Around Price” is a model defined by IntoTheBlock that helps us visualize strong resistance and support areas. The $355-level represents a strong resistance zone where nearly 932.2k addresses had previously purchased 14.45M ETH. This resistance wall looks strong enough to absorb an immense amount of buying pressure.
ETH/USD 4-hour chart
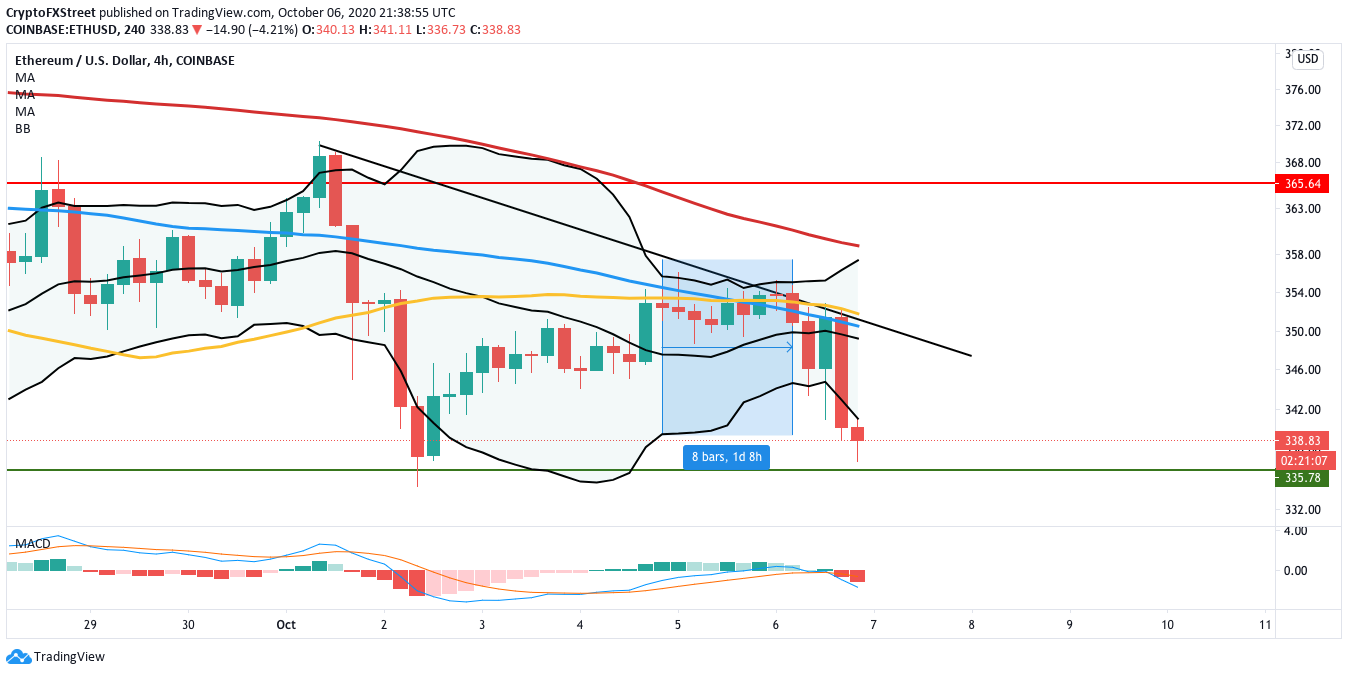
The 4-hour chart shows us that ETH was going through a period of low volatility, as evidenced by the Bollinger band’s squeezing. The bears managed to break through as ETH candlesticks plummeted after charting a bearish engulfing pattern. The TD sequential shows that support, in this time frame, lies at $330. However, the MACD shows increasing selling momentum, so the overall outlook for ETH looks bearish.
Ethereum holders remain optimistic despite bearish action
Despite the bearish price, multiple indicators show that sentiment among the whales and other long-term holders remains optimistic. Santiment is a behavior analytics platform for cryptocurrencies that provides numerous indicators to gauge the overall network healthy and public sentiment towards individual projects. So, let’s see what we can learn about Ethereum through these indicators.
Note: All the indicators will be using a 3-month time-frame.
Miners balance
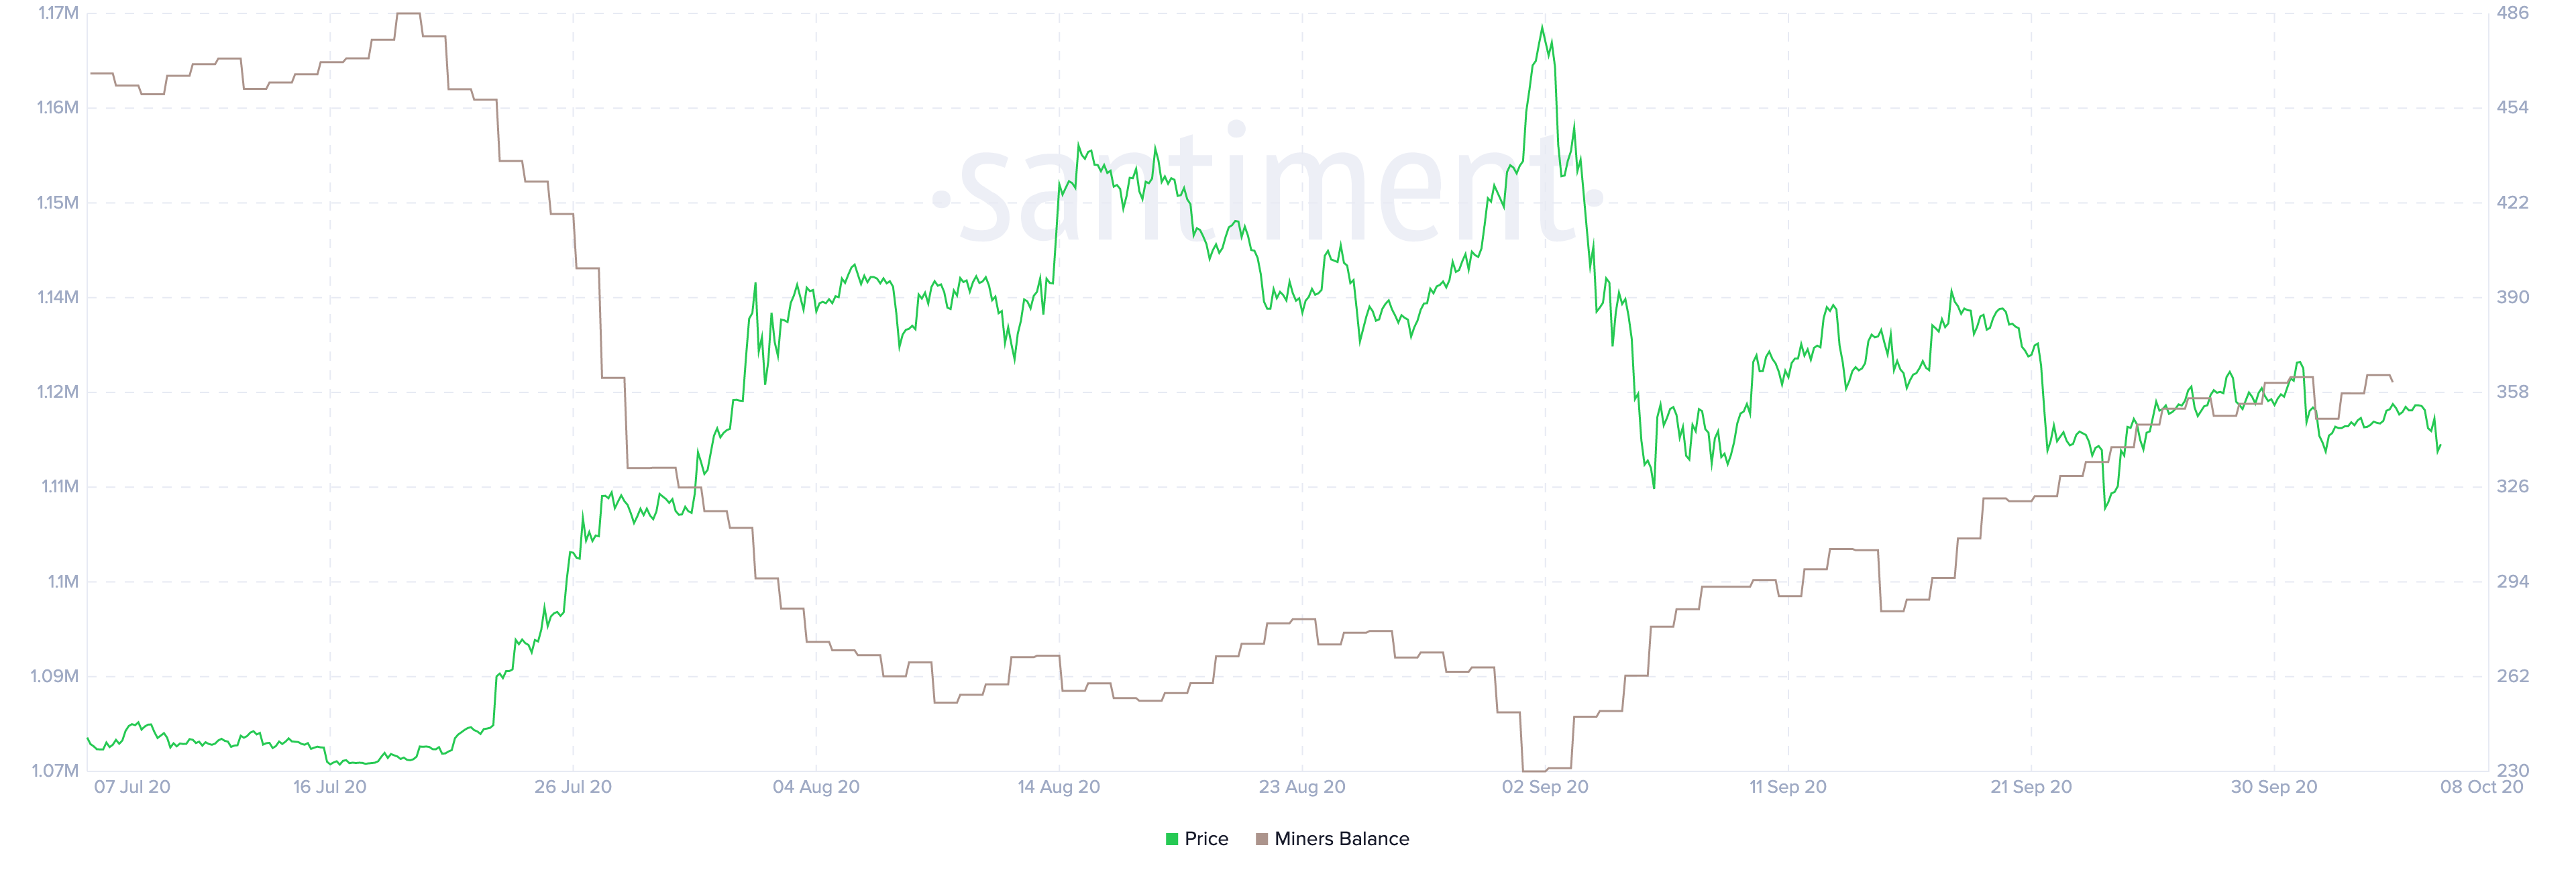
Miners balance is a metric that shows us the total amount of ETH held by the miners. As per the metric, the miner balance dropped to a low of 1.07M on September 1. Following that, the total miner balance has steadily gone up. As of now, around 1.13M ETH is currently held by miners. This is a positive sign since this shows us that the miners are holding on to their mined coins instead of selling them off immediately.
Along with the miners, another key group that determines the Ethereum’s network healthy and price action are the whales, aka, holders with substantial ETH.
ETH Holder Distribution
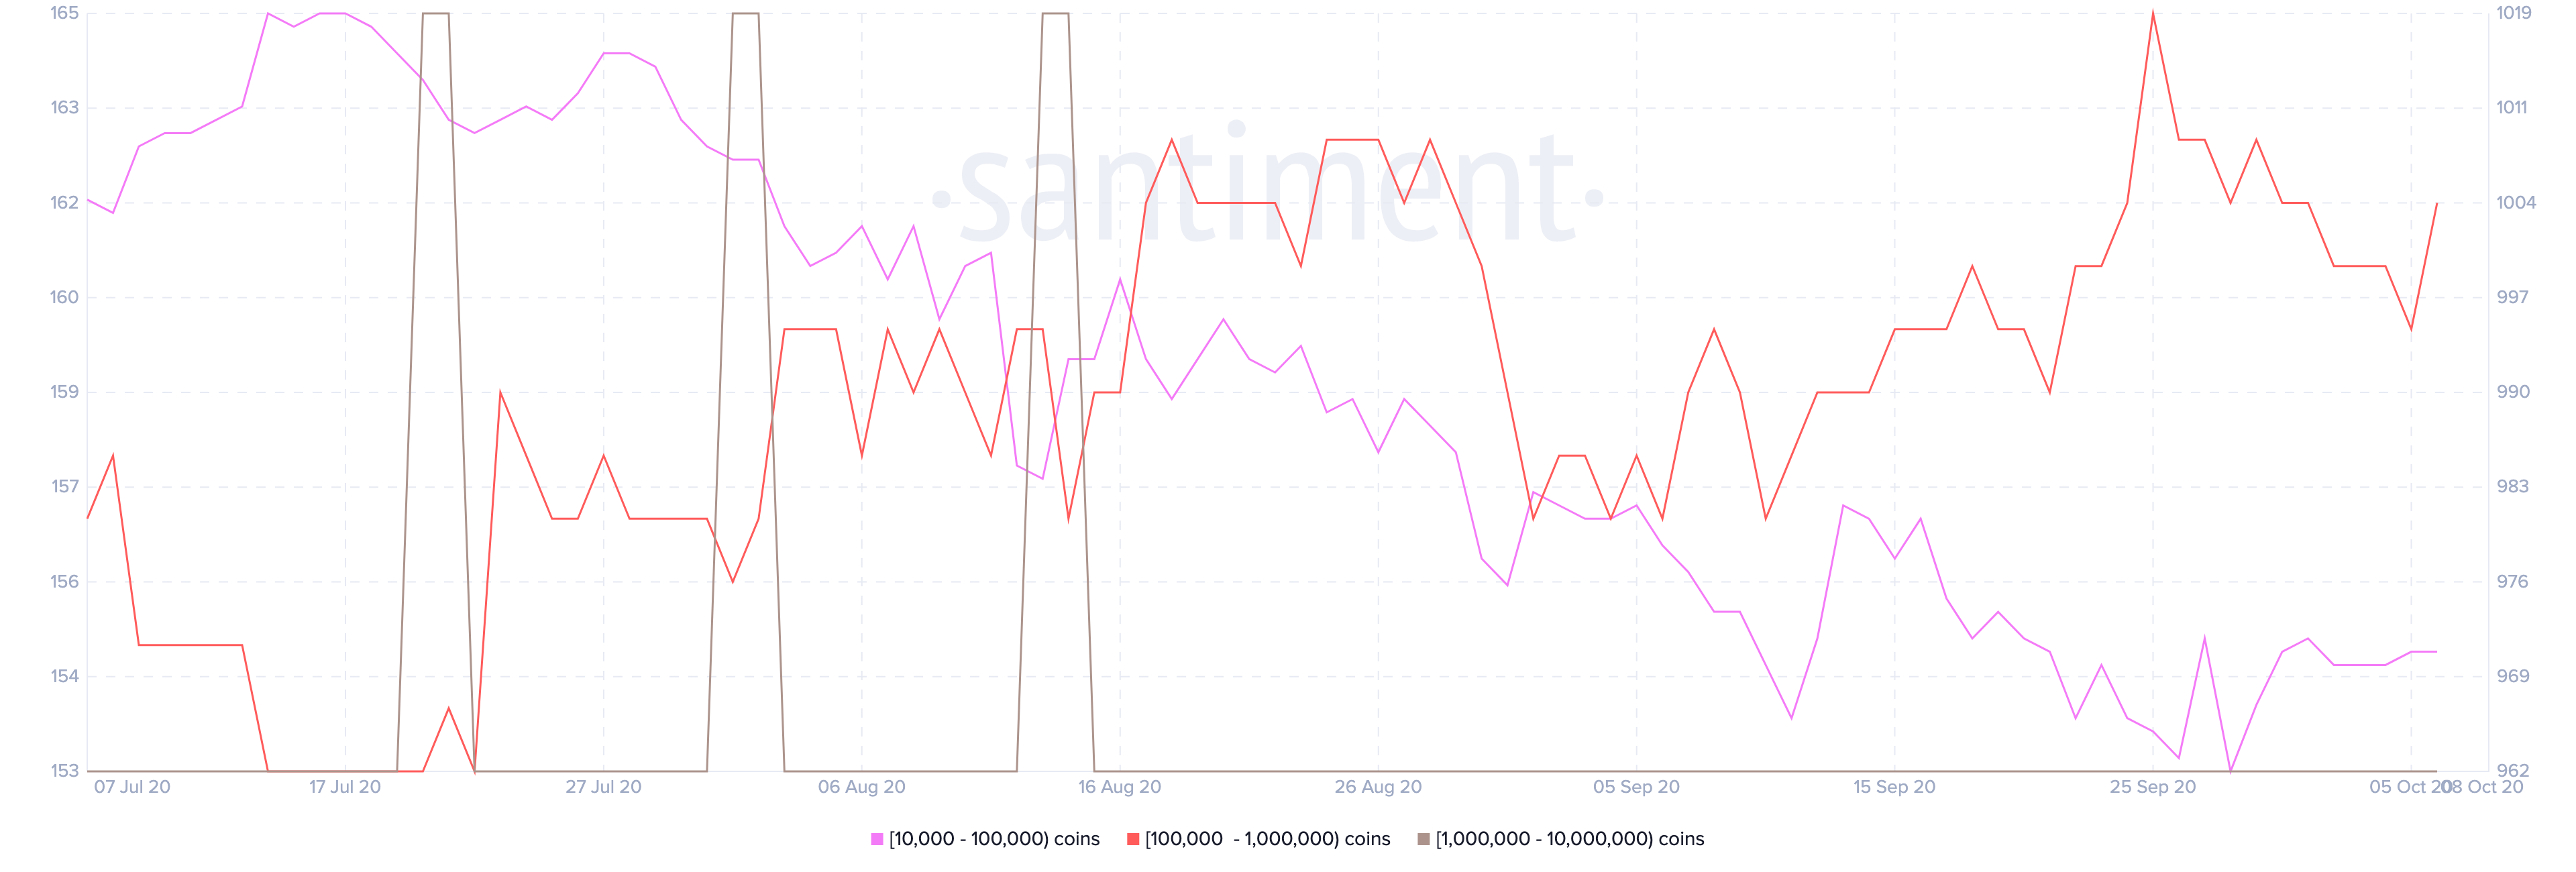
The holder distribution charge allows us to visualize the number of holders in different brackets. In the chart above, we can ETH holders in the 1M-10M, 100,000-1M, and 10,000-100,000 brackets. Since August 15, Ethereum has had 5 mega whales holding 1M-10M ETH.
The number of holders in the 100,000-1M bracket went up from 153 on July 20th to 165 on September 25. Since then, this number has decreased to 160, as of press time.
Finally, the 10,000-100,000 bracket has gone down steadily from 1,019 on July 16 to 962 on September 28. The number of holders in the category has since increased to 970.
While it’s evident that the number of whales has decreased steadily in the three-month time-frame, it could be possible that instead of selling off their coins, they have merely locked them up in different DeFi protocols to participate in yield farming.
Amount held by top 100 non-exchange addresses
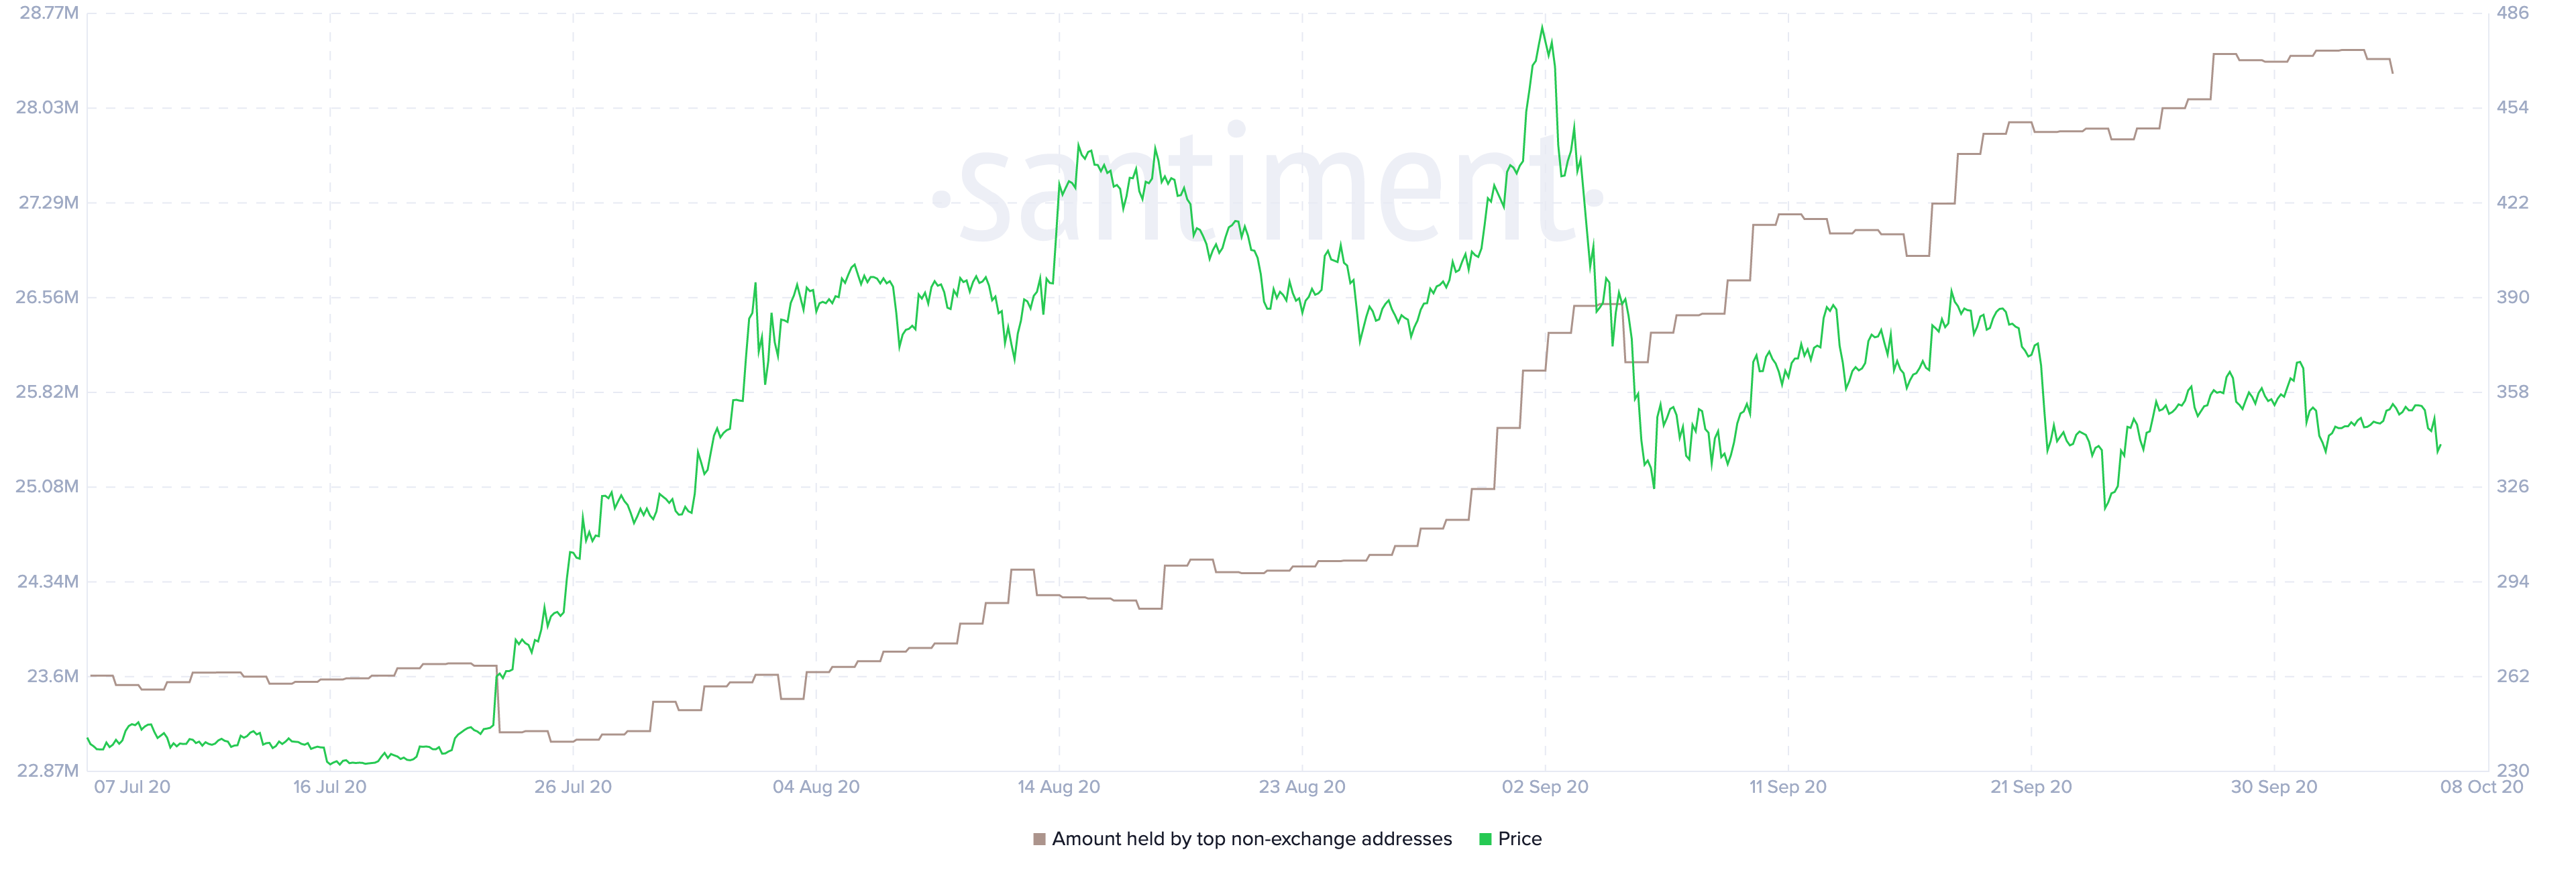
This chart helps us see the amount of ETH tokens held by the top 100 non-exchange addresses. Despite slight drops, this number has increased steadily over time. Since July 23, the amount of ETH owned by the top 100 holders has risen from 23.17M to 28.41M. This shows that regardless of the price, the whales are on a shopping spree and are busy consolidating their positions.
Mean Coin Age
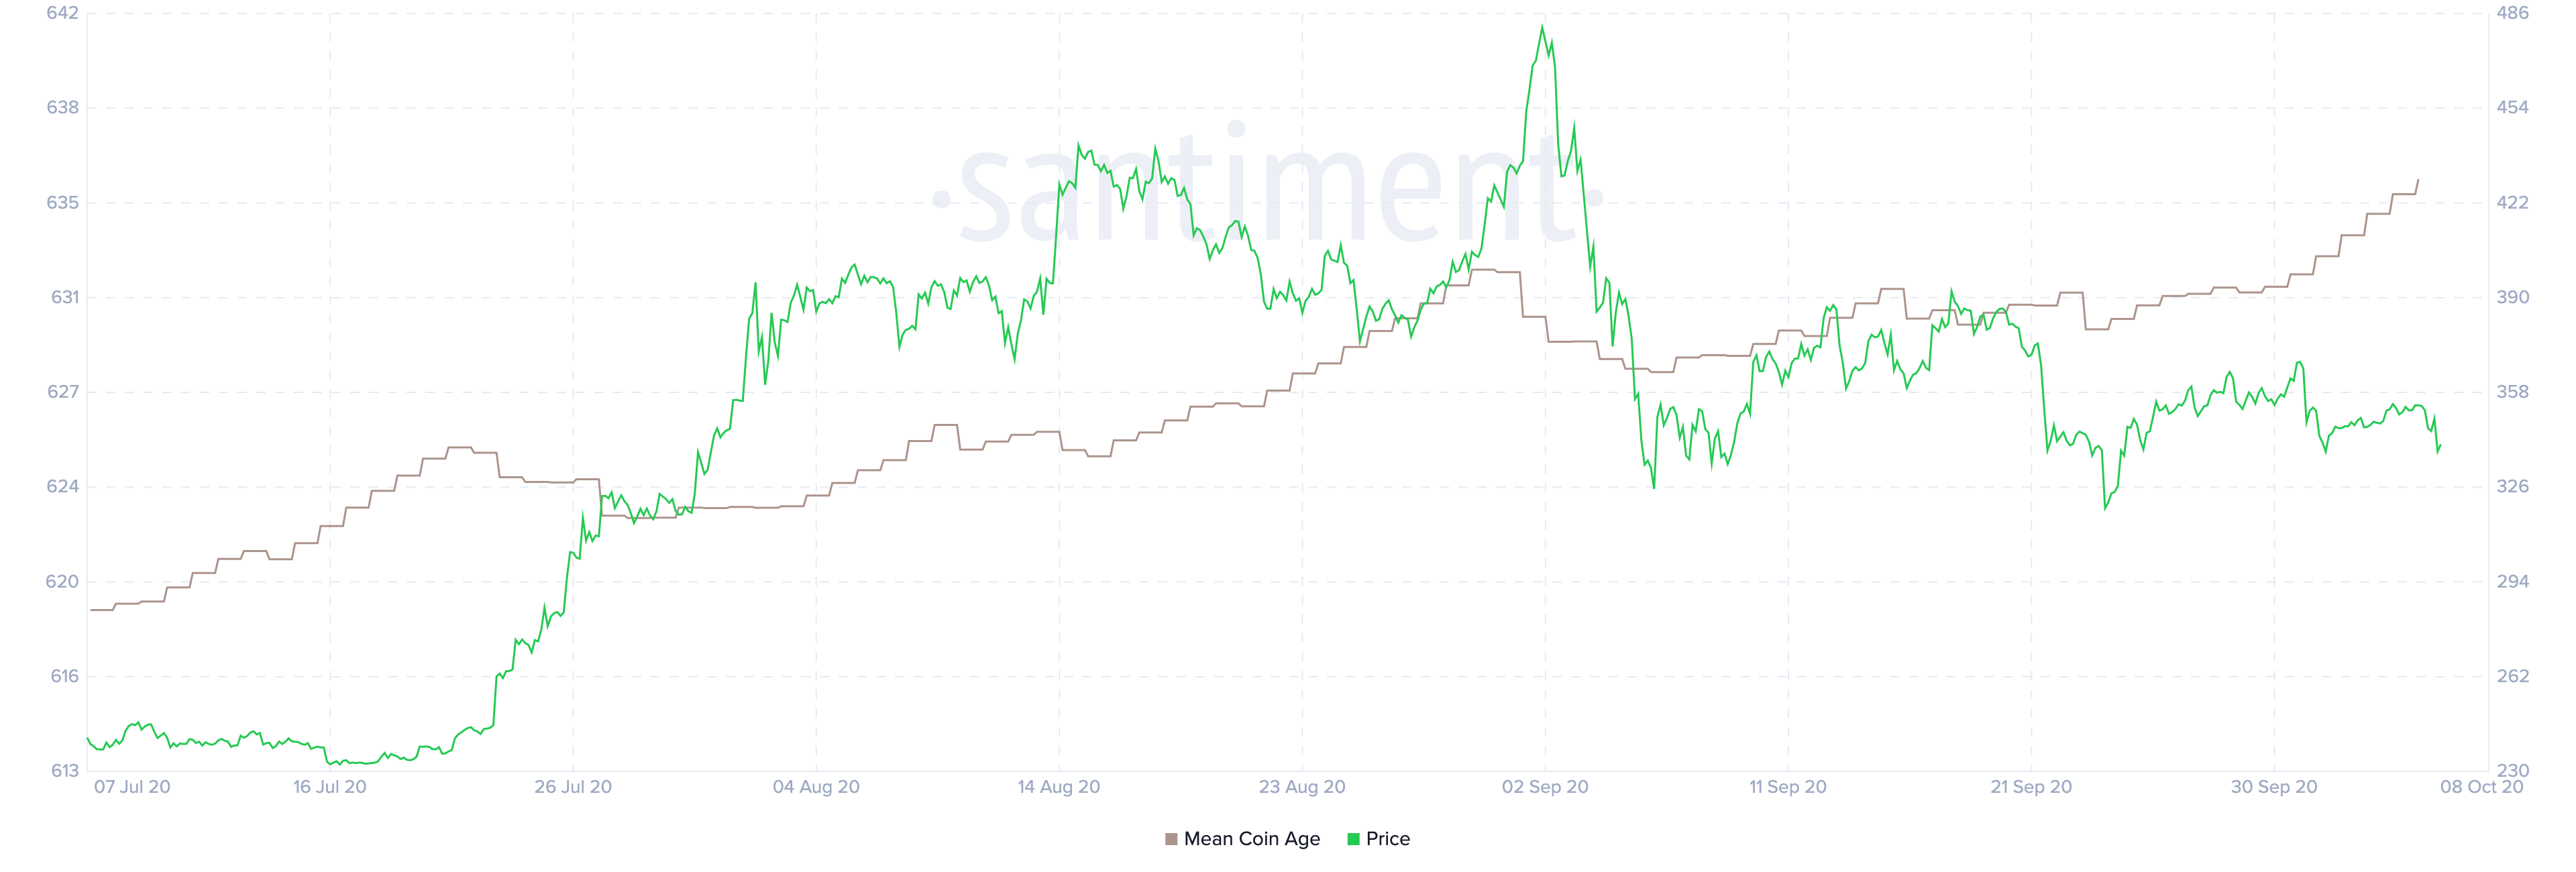
“Patience” and “accumulation” seems to be the theme among the long-term Ethereum investors. This chart visualizes Ethereum mean coin age (MCA), i.e., the average amount of days all ETH has stayed in their current addresses. A rising trend in this chart shows us that the network is currently in an accumulation phase.
Following a dip between August 31 – September 7, the MCA has risen from 628.64 to 635.46. So, despite uncertain market action, the long-term investors have kept their faith in Ethereum and have opted to accumulate.
Coin supply on exchanges
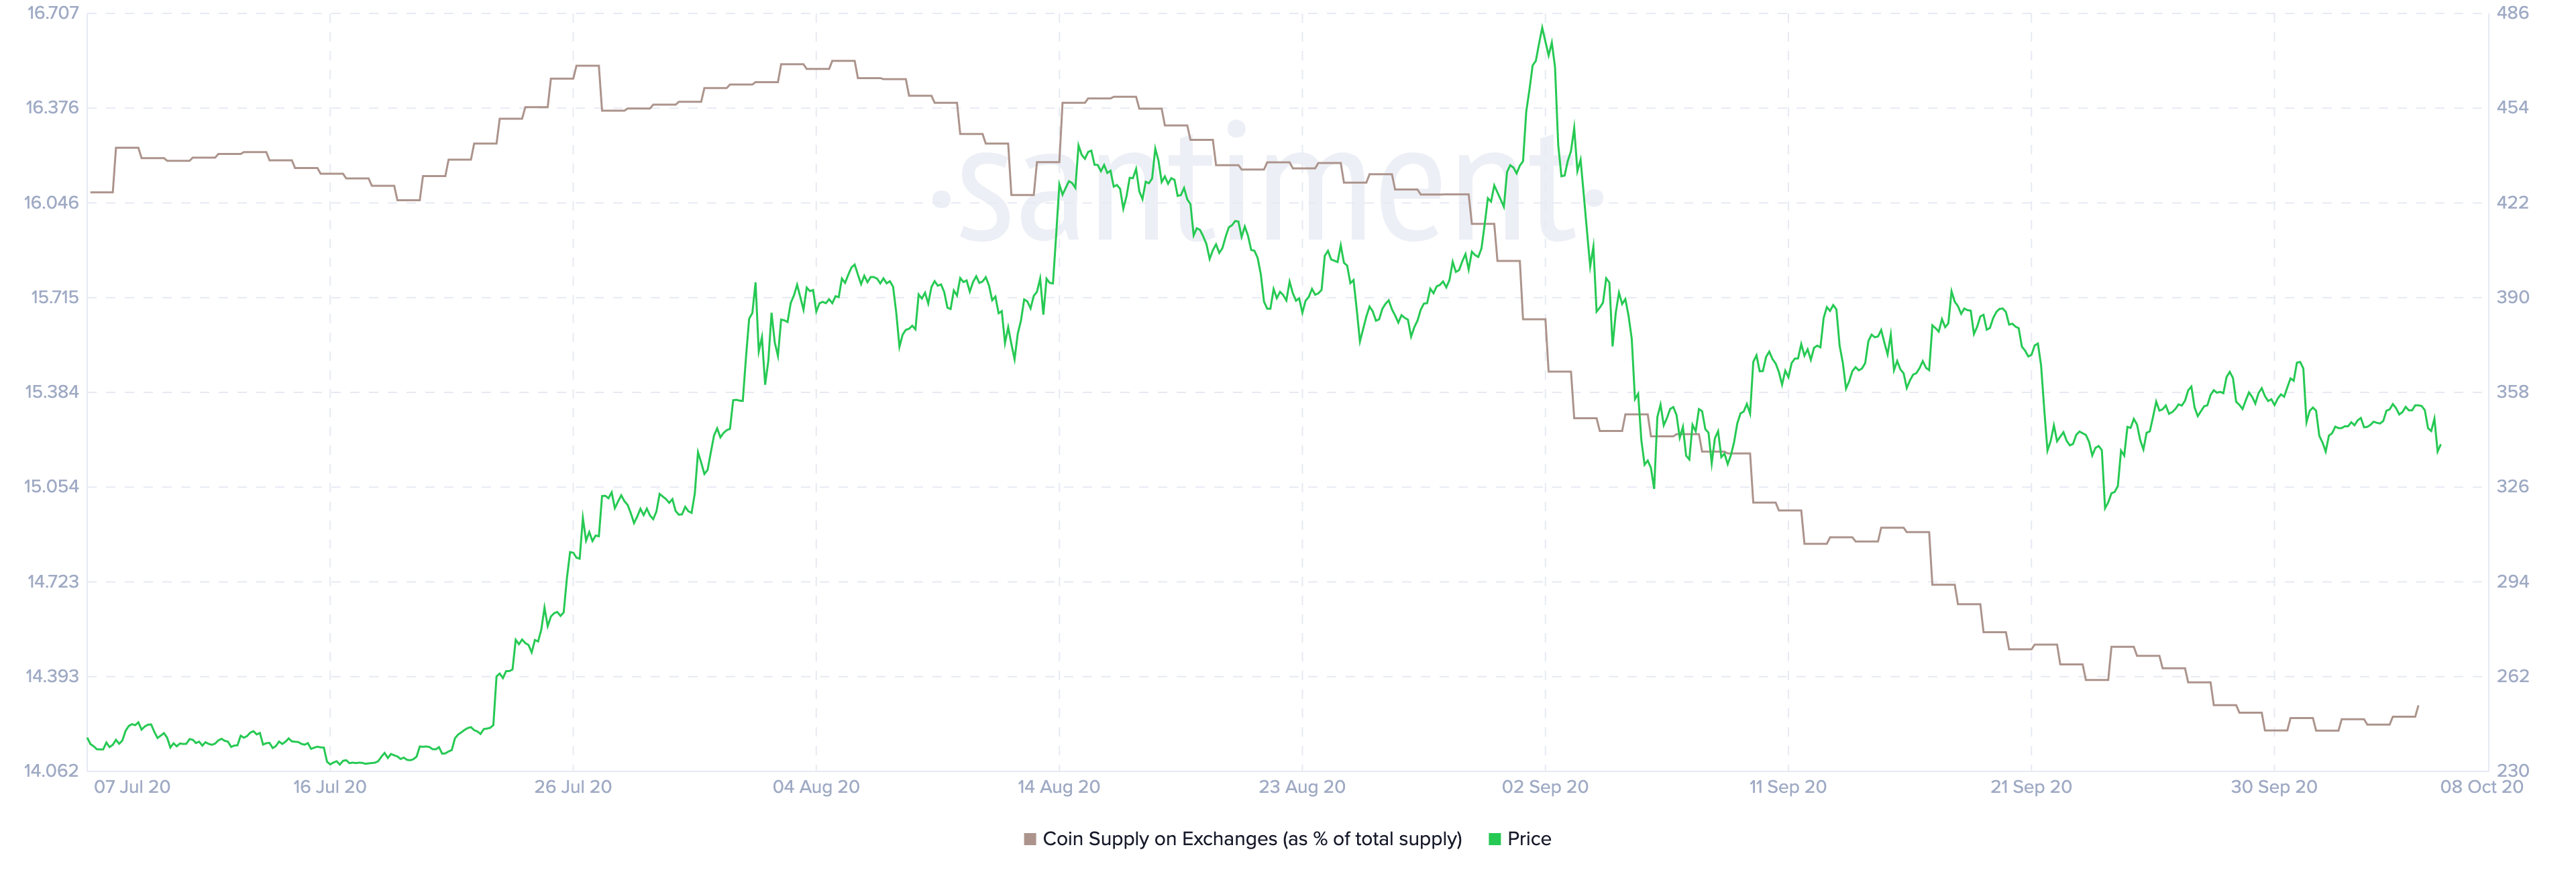
The final chart we will be looking at is the “Coin supply on exchanges.” This chart shows us the percentage of the total circulating supply of ETH located in known exchange wallets. A drop in this metric tells us that instead of keeping their coins in exchange wallets and waiting to sell them off, the holders have opted to transfer them to their own wallet to hold on to their assets. Since August 14, the coin supply has reduced from 16.39% to 14.25%.
Verdict: Technical analysis shows us that Ethereum is currently under selling pressure as the bears aim to drop the price to the $305 support line. However, the whales and long-term investors remain optimistic and have retained their faith in the smart contract leader.
