- ETH/USD went down from $169 to $160.75.
- The price is currently approaching the critical $155 support level.
ETH/USD went down from $169 to $160.75, charting a 4.88% drop this Monday. After failing at the $180 level, ETH/USD has been steadily falling over the past week. There have been consolidation attempts, but the overall sentiment has been bearish. This Monday, the price found support at the 20-day simple moving average (SMA 20) curve. If the bears breach past SMA 20 support, then they will be testing the critical support level at $155. On the upside, the resistance levels lie at $170, $175, and $180 levels.
ETH/USD Daily Chart
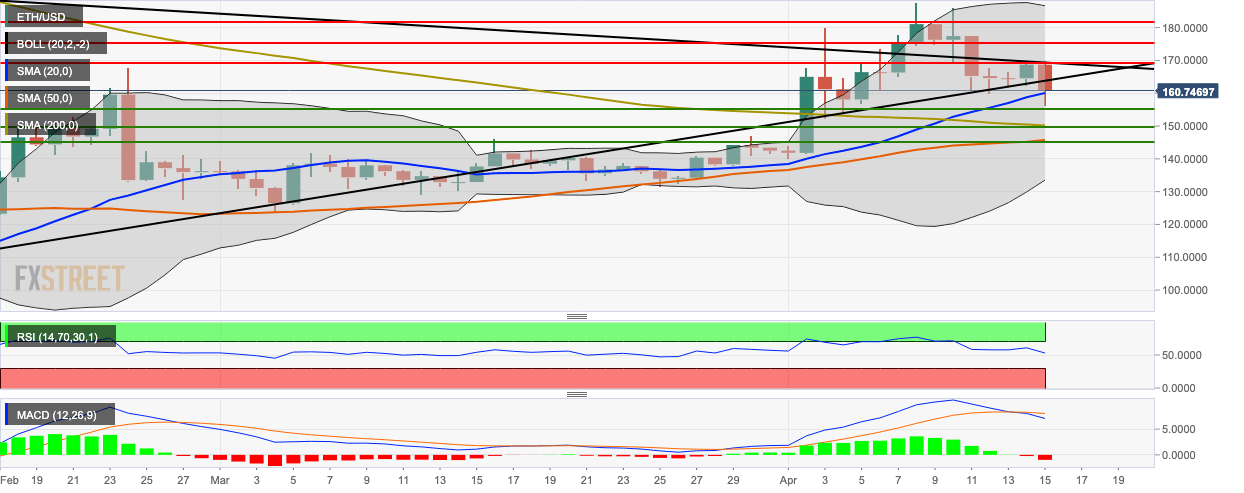
- The price has touched the SMA 20 curve and is above the SMA 200 and SMA 50 curves.
- The 20-day Bollinger band has narrowed, which shows decreasing market volatility.
- The Relative Strength Index (RSI) indicator is trending around 52.
- The signal line has diverged away from the moving average convergence divergence (MACD) line showing greater bearish momentum.
