- Ethereum price recovered and brushed shoulders with $320 but the bears returned the crypto to the drawing board at $280.
- A break from the triangle resistance at the 50% Fibo could see further retracement on the upside.
Ethereum extended the upside above the key resistance at $300 during the weekend trading. The price brushed shoulders with $320 but the bears capped the gains at the 61.8% Fib retracement level with the last drop from $363.4 to $248.9 at $320. The lower corrections that came after the failure to break the hurdle found a support above $280.
Ethereum price is trading within a contracting triangle approaching a breakout in the near-term. However, the short-term resistance at $300 must be overcome first and a support created above this line. Trading past the 50% Fib level is likely to result in an upside breakout from the triangle resistance towards the upper supply zone at $320. On the contrary, if the triangle support is broken around $290, ETH/USD will break down in the direction of $280 support.
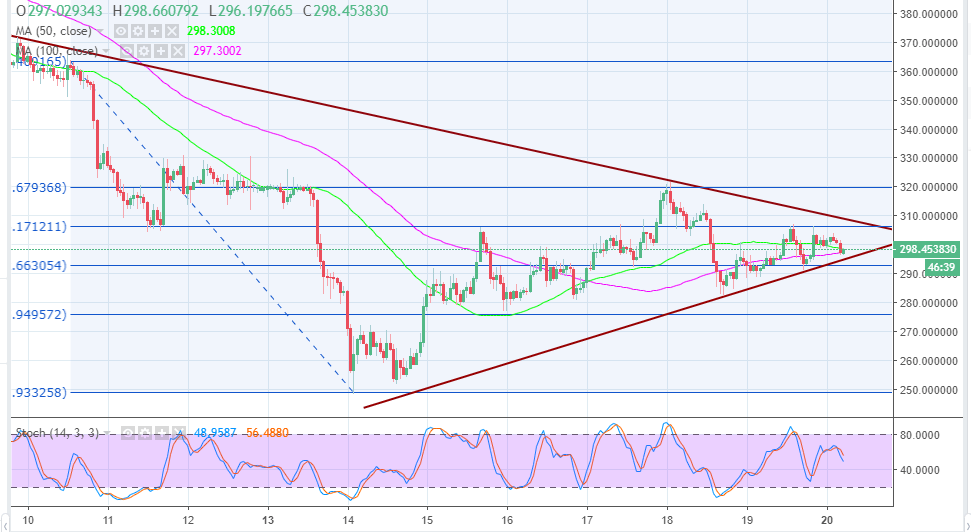
The 100-day hourly simple moving average is offering immediate support while the 50-day moving average limits gains on the upside. A subtle bullish trend is forming on the chart but the stochastic is still pointing upwards showing that the bears are still present. ETH/USD is trading at $298. If the trend extends further south, $290 short-term support will try to hold but the key support is at $280. Ethereum buyers need to find a support above $300 to stay away from dips into the $280 – $299 range.
ETH/USD hourly chart