- Ethereum price is trading up around 1.8% in the latter part of Friday.
- ETH/USD price action has formed a bearish flag pattern via the 4-hour chart view.
The Ethereum price late on Friday was seen holding gains of around 1.8%, after a generally subdued trading day. Across the cryptocurrency market, many coins continue to move within a range-bound nature.
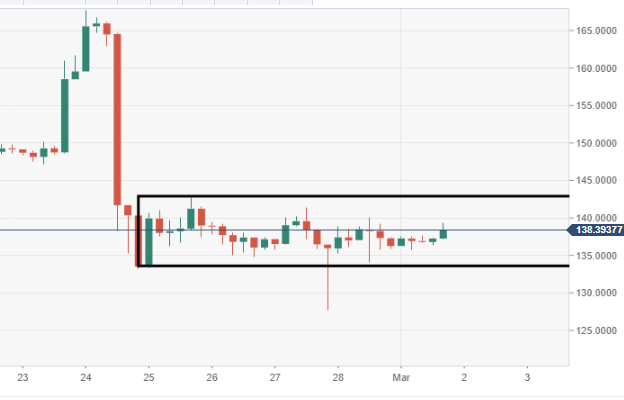
ETH/USD price action via the 4-hour chart view is moving within a bearish flag pattern formation, which is subject to a potential breakout to the downside. The price at present just moving within the confinements of the flag itself.
Technically, given the above-detailed pattern, eyes are on further potential moves to the downside. A breach could open the door to a strong wave of selling pressure, eyes will initially be on the $125-120 region, this coming just ahead of a return to the big $100 mark.
ETH/USD 4-hour chart