- Elliott Oscillator has had 10 green sessions out of the last 11.
- The MACD indicator shows increasing bullish momentum.
ETH/USD daily chart
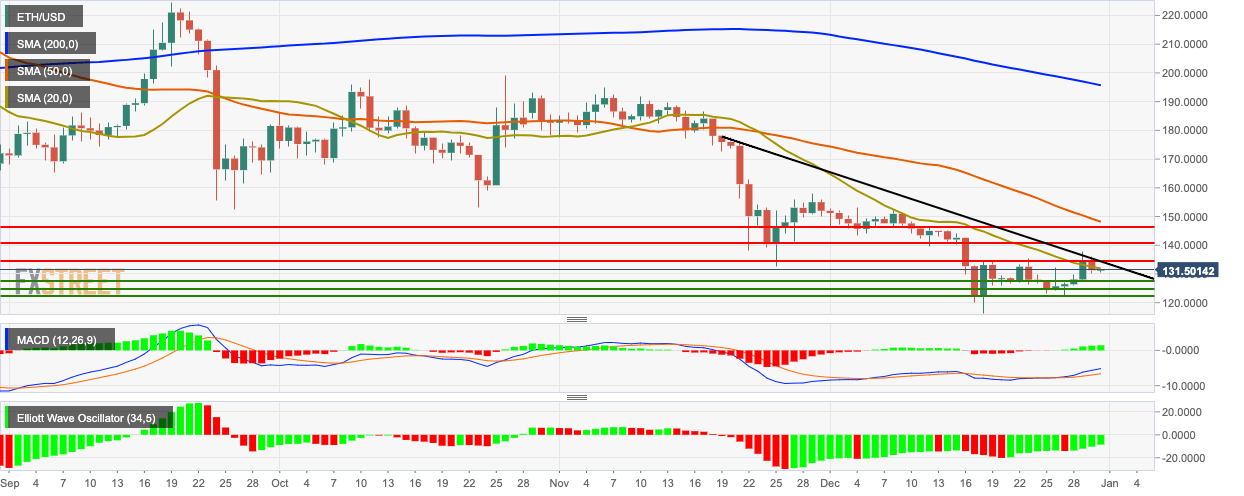
ETH/USD fell from $134.50 to $131.25 this Monday, following four straight bullish days, which say the price rise from $125.15 to $134.50. The price has risen to $131.45 in the early hours of Tuesday after bouncing off support at the 20-day Simple Moving Average (SMA 20) curve. The Elliott Oscillator has had 10 green sessions out of the last 11, while the Moving Average Convergence/Divergence (MACD) indicates increasing bullish momentum. Both these tools show that despite this Friday’s bearish movement, the overall sentiment of Ethereum is definitely bullish.
