- Ethereum price is trading in the green by 5.60% in the session on Wednesday.
- ETH/USD bulls are making strong strides towards a psychological $200 retest.
- Near-term term price action has smashed out of a bullish flag structure, inviting a strong wave of upside momentum.
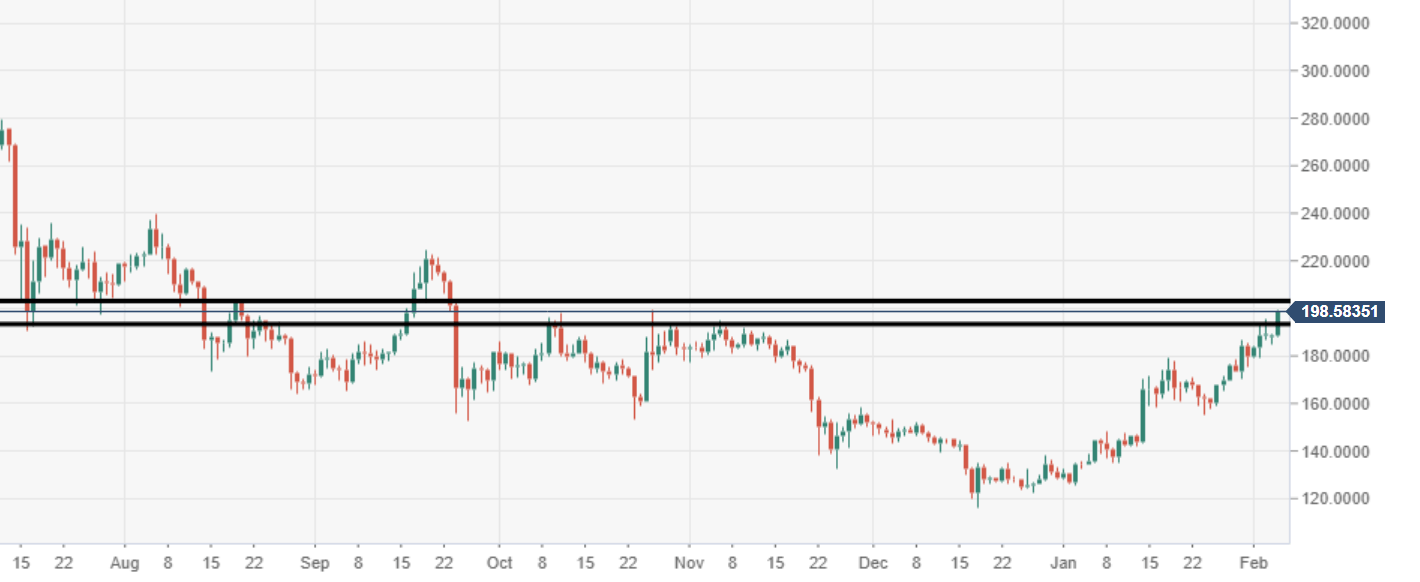
ETH/USD daily chart
The price is running towards its fifth consecutive session in the green, highest levels now since October 2019.
ETH/USD 60-minute chart
Price action has breached a bullish flag, inviting a fresh wave of buying pressure.
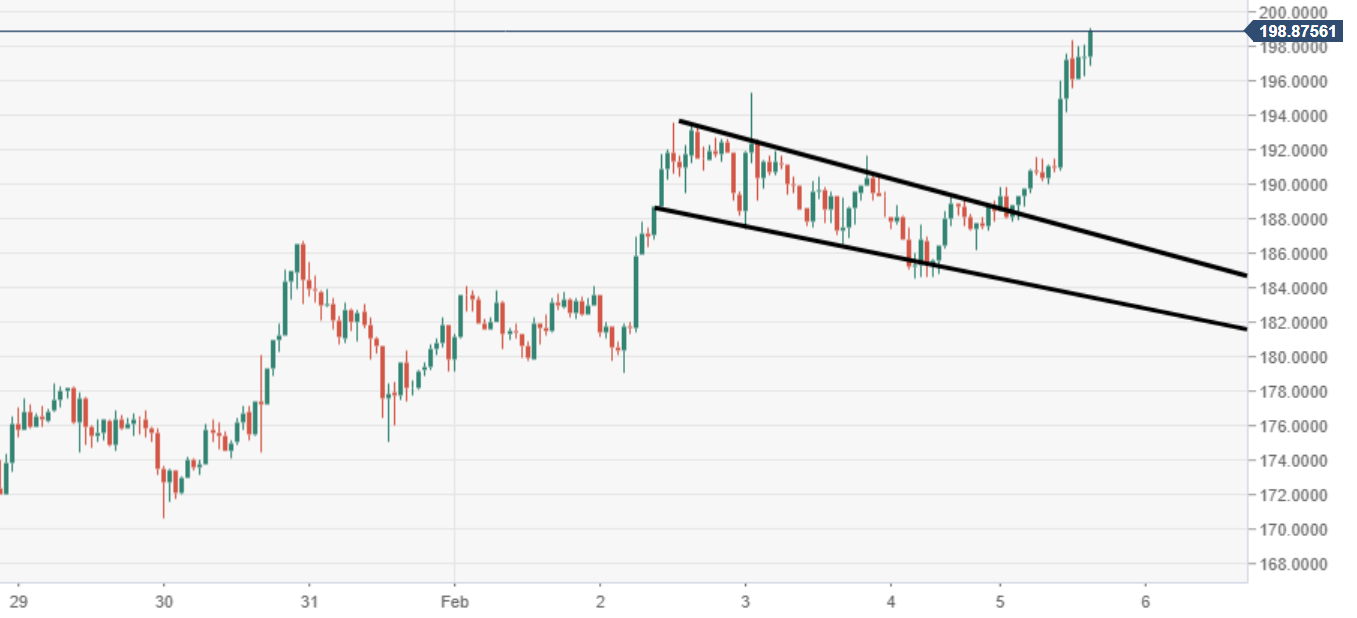
Spot rate: 198.62
Relative change: +5.60%
High: 199.09
Low: 187.82
