- ETH/USD is trending in a triangle pattern formation.
- The MACD indicator shows a reversal of bullish momentum.
ETH/USD daily chart
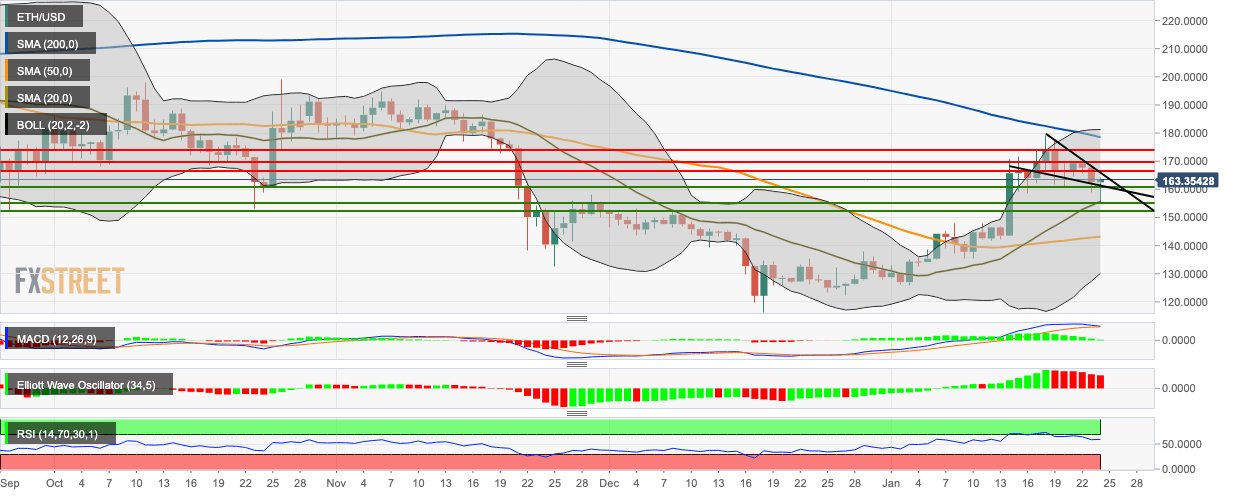
ETH/USD bulls took control this Friday, as the price went up slightly from $162.55 to $163.30. The price is consolidating in a triangle formation and has found support at the SMA 20 curve. The MACD line has touched the signal line, indicating a reversal of bullish momentum. The Elliott Oscillator has had five straight bearish sessions, while the RSI indicator is hovering around 62.50, showing that the market is going through a consolidation period.
