- Ethereum price declines broke $290 and $280 support lines but buyers held ground at $270.
- The path of least resistance to the north, besides ETH/USD is up more than 2% on the day.
Ethereum price recently came close to trading at $320 but lost momentum around $318.The declines that followed after this found a support at the bullish trendline on the hourly chart. There was another bullish recovery above $300 critical resistance level but the 50% Fib retracement level of the previous swing high of $363.4 and a low of $248.9 limited the movement at $306.11.
This week’s trading began with ETH/USD making lower corrections below $300. The declines broke the trendline support at $296. Further breakdown continued below the short-term support at $290. The slide was unstoppable $280 but the bulls held ground at $270. Ethereum is currently flirting with the 23.6% Fib level at $276. The trend is slightly bearish but technical indicators are sending bullish signals
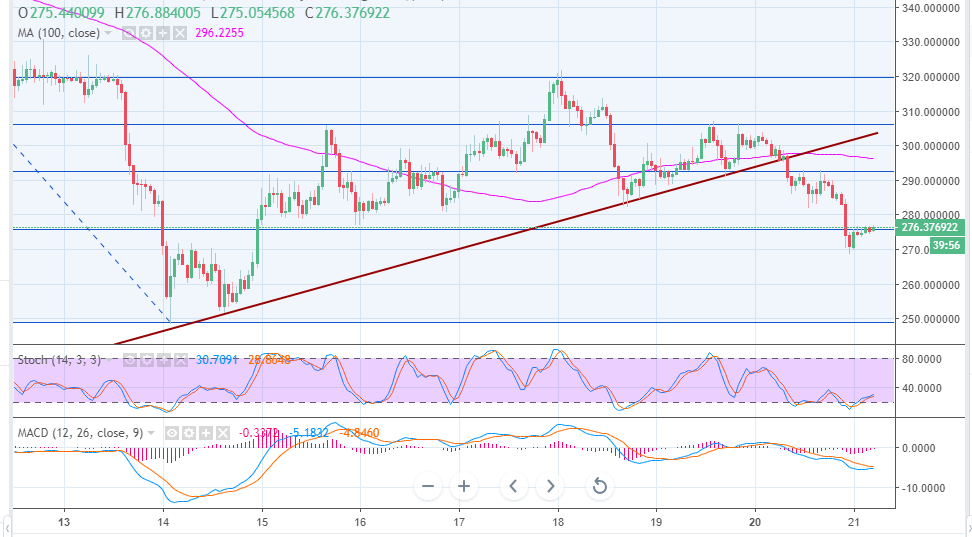
Ethereum buyers are fighting for entry positions at $276. The stochastic is pointing north above the oversold while the MACD has changed the slop and is currently ranging in the negative region. The broken support at $280 will offer resistance as the buyers push for a pullback. The path of least resistance at the moment is the upside. A break above $280 will encounter stiff resistance at $285 and $290 respectively. The ultimate medium-term resistance is at $300.
ETH/USD 1-hour chart