- Ethereum price is trading in the green by 0.80% in the session on Monday.
- ETH/USD has resumed momentum to the upside following cooling between 18-25 January.
- The bulls are running towards the second session in the green, following four straight days of losses.
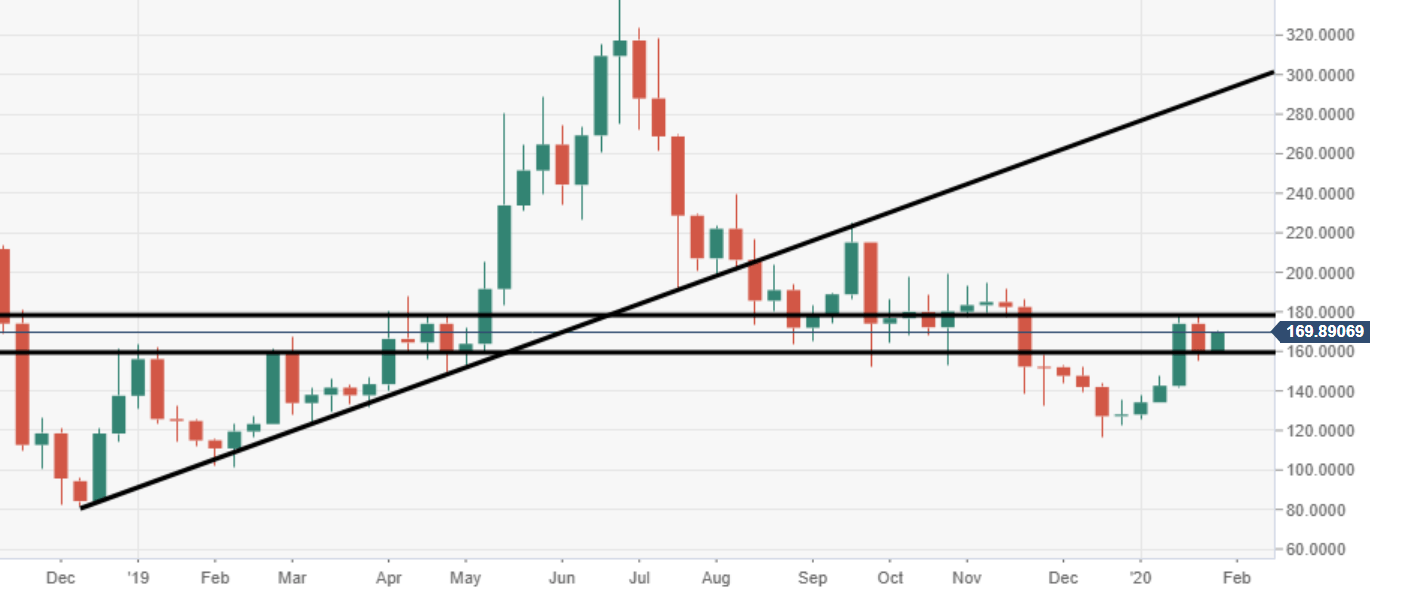
ETH/USD weekly chart
A strong area of weekly supply should be noted at the range of $175-180. A break here can open the door to greater moves north.
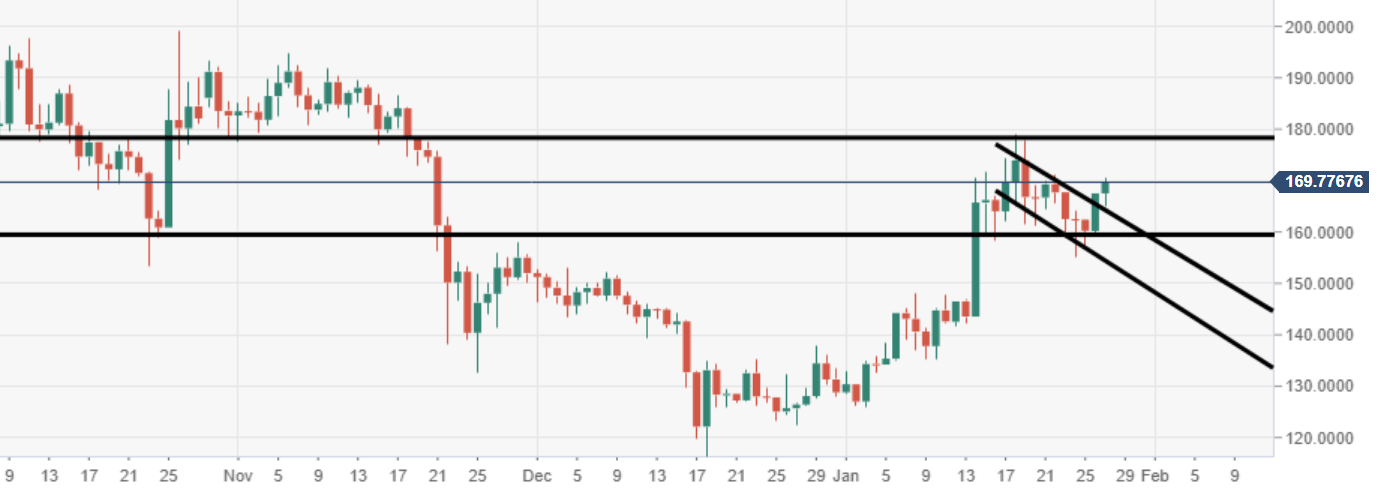
ETH/USD daily chart
Price action has broken out of a bullish flag structure via the daily, inviting further pressure north.
Spot rate: 169.80
Relative change: +1.35%
High: 170.56
Low: 165.01
