- Ethereum price is trading in the red by -0.80% in the session on Wednesday.
- The bulls pressed for a big double-digit rally on Tuesday, breaking out of a bearish trend structure.
- In terms of upside targets, the door has been left open for a return into $200.
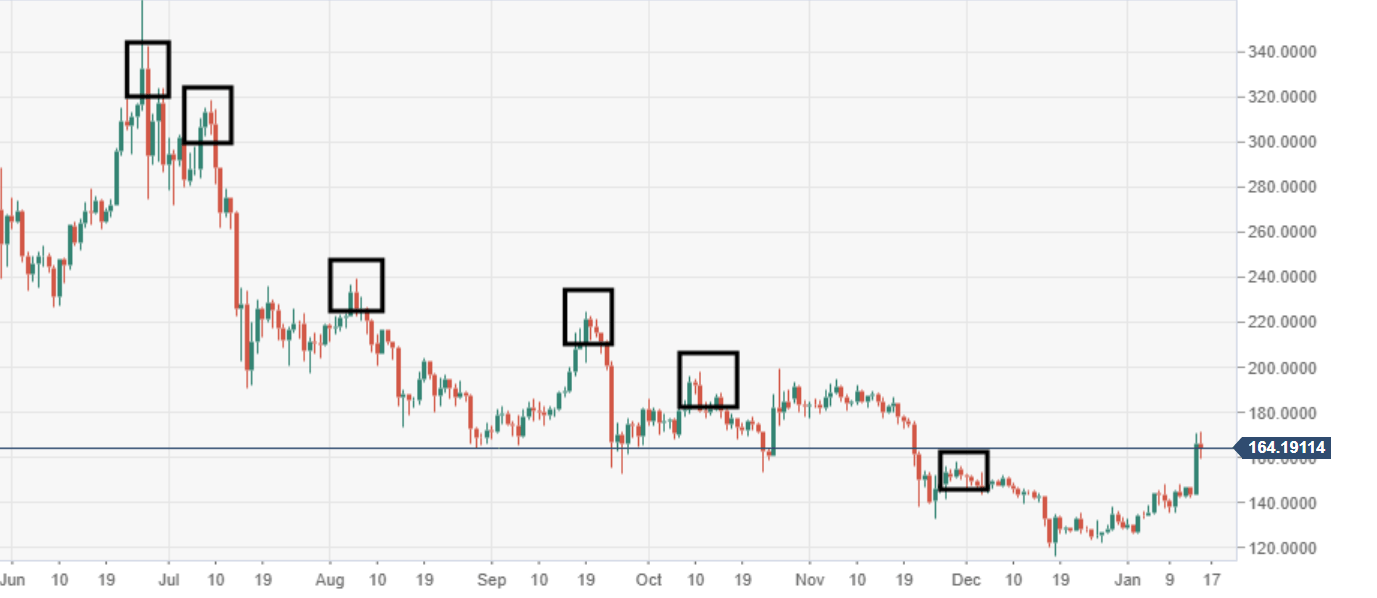
ETH/USD weekly chart
The current weekly candle is on course for its best performance since the week commencing 20 September. Bulls are running towards the fourth consecutive in the green.
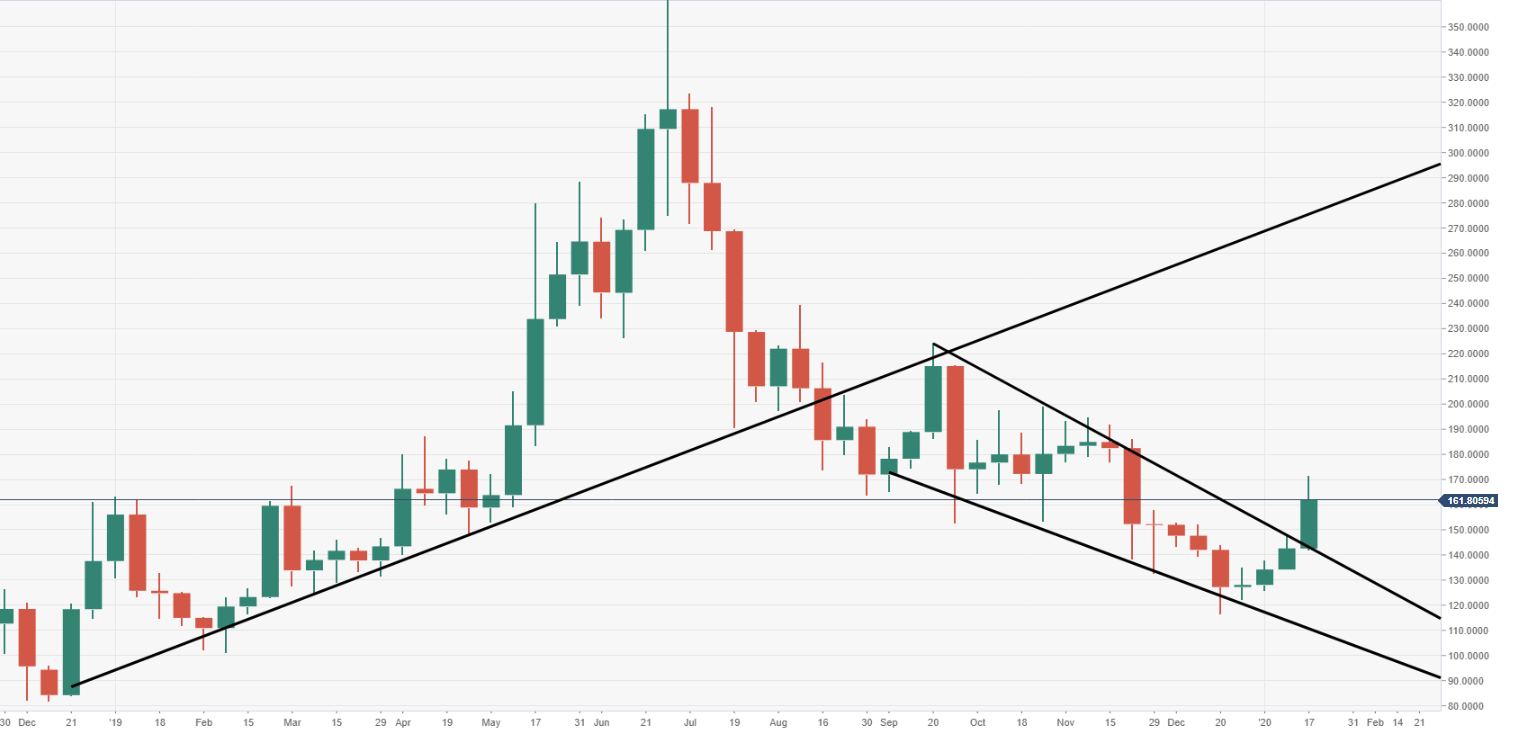
ETH/USD daily chart
Price action since June 2019 had been stuck within the market structure of producing lower highs and lower lows. However, the bulls in the session of Tuesday broke above the prior lower high, effectively voiding the structure.
Spot rate: 164.33
Relative change: -0.85%
High: 171.67
Low: 143.50
