- Earlier this Monday, ETH/USD dropped from $123.45 to $111.75.
- The RSI indicator is looking to creep above the oversold zone as bulls take back control.
ETH/USD daily chart
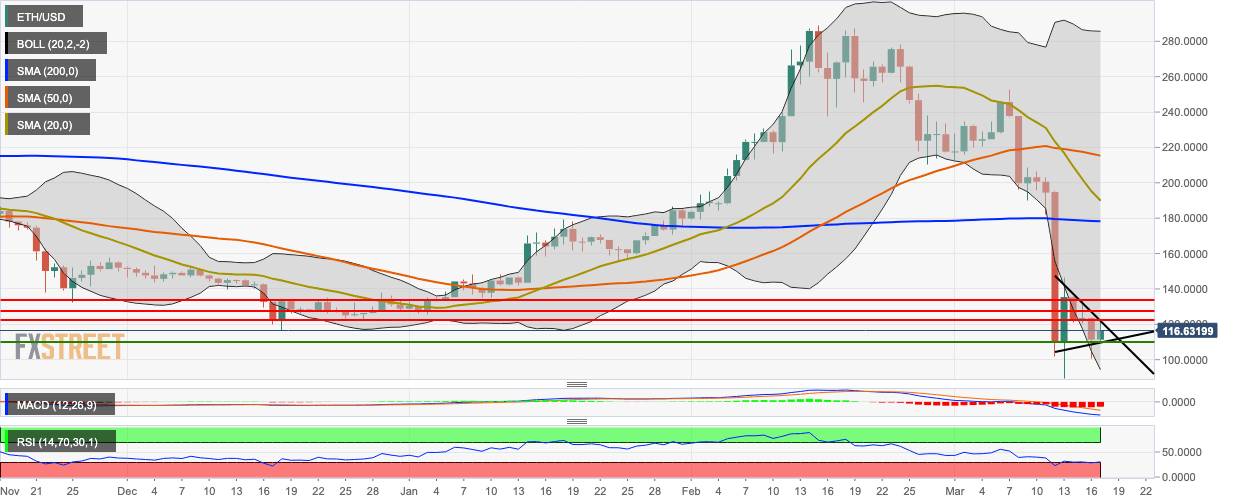
ETH/USD bulls took control of the market this Tuesday as the price went up from $111.75 to $117.57 as they aim to take the price back above the $120-level. This followed a bearish Monday wherein the price fell from $123.45 to $111.75. The price is currently consolidating in a flag formation and has found support on the lower curve of the 20-day Bollinger Band. The MACD indicates sustained, yet decreasing bearish momentum, while the RSI indicator is looking to creep above the oversold zone following this Tuesday’s bullish price action.
