- ETH/USD is currently trading around $222 in the early hours of Saturday.
- The SMA 50 curve has crossed over the SMA 20 curve.
ETH/USD had a bearish Friday, wherein the price fell from $226.40 to $221.60. In the early hours of Saturday, the price has gone up slightly to $22. The hourly chart shows us that there are two intra-day resistances at $226 and $224.50. After finding support at $216.35, the price was able to get up steadily to $222.
ETH/USD daily chart
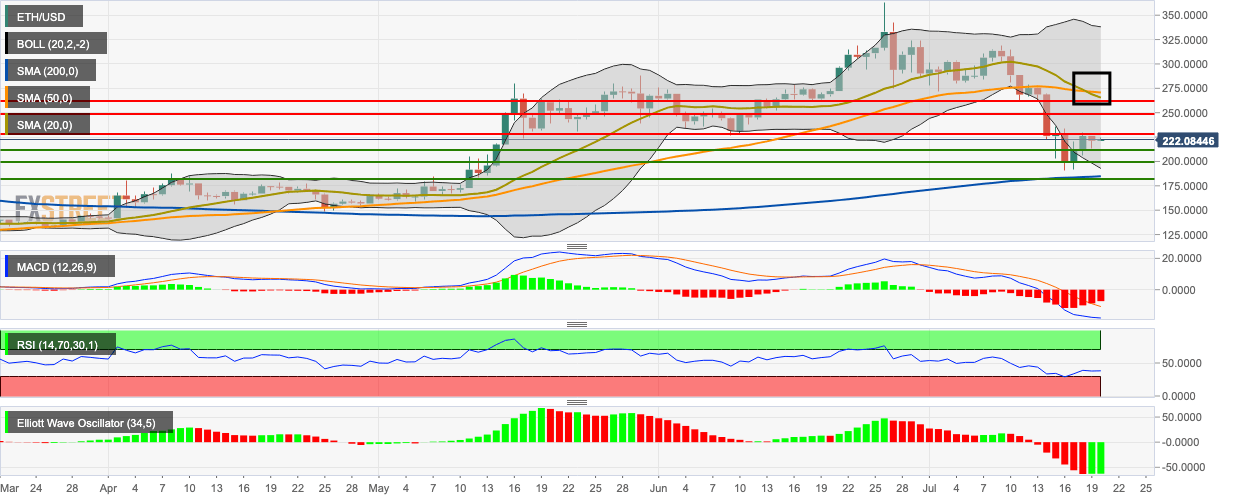
The price has re-entered the 20-day Bollinger band after the bulls stepped back in to correct ETH/USD. The 50-day simple moving average (SMA 50) has crossed over the SMA 20 curve, which is a bearish signal. The relative strength index (RSI) indicator is trending around 39.50, right next to the oversold zone. The Elliot oscillator has had two bullish sessions after nine straight bearish sessions. The moving average convergence/divergence (MACD) indicator shows sustained bearish momentum.
