- Ethereum price is trading in the green by 1.80% in the session on Thursday.
- ETH/USD price action is flirting with the upper acting trend line of a bullish channel structure.
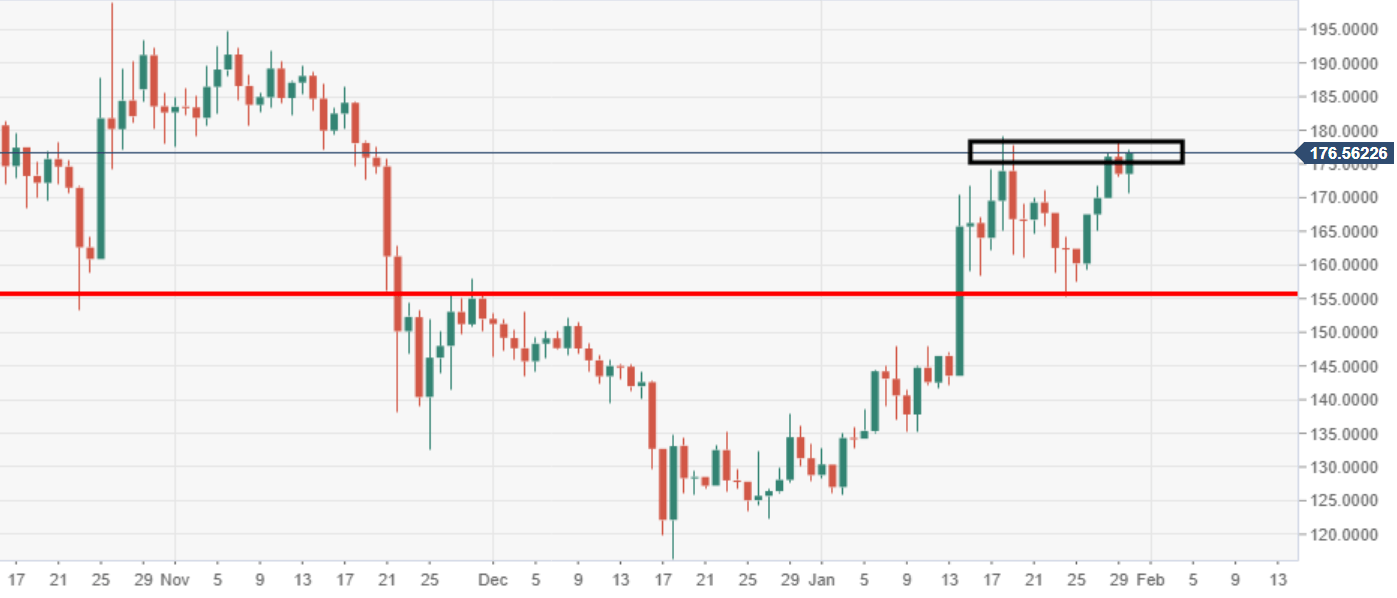
- A double top formation can be observed via the daily chart view.
ETH/USD daily chart
Price action is moving within an ascending channel structure via the daily chart view.
ETH/USD 60-minute chart
A near-term bearish flag structure can be observed via the 60-minute chart view.
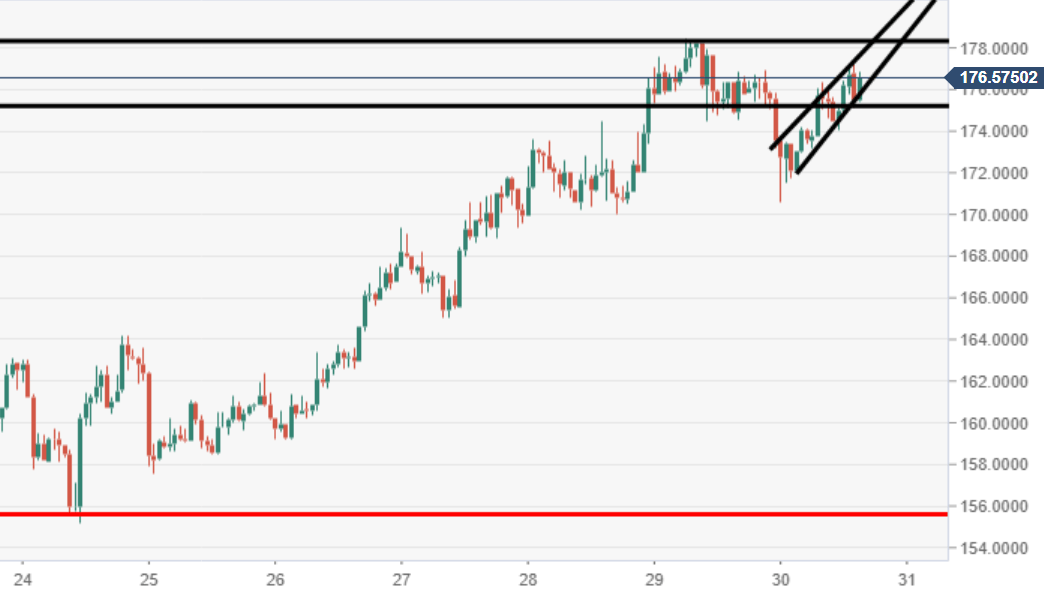
Spot rate: 176.60
Relative change: +1.80%
High: 177.18
Low: 170.60
