- The RSI indicator is trending around the neutral territory over the last ten days.
- The Elliott Oscillator has had three green sessions out of the last five.
ETH/USD daily chart
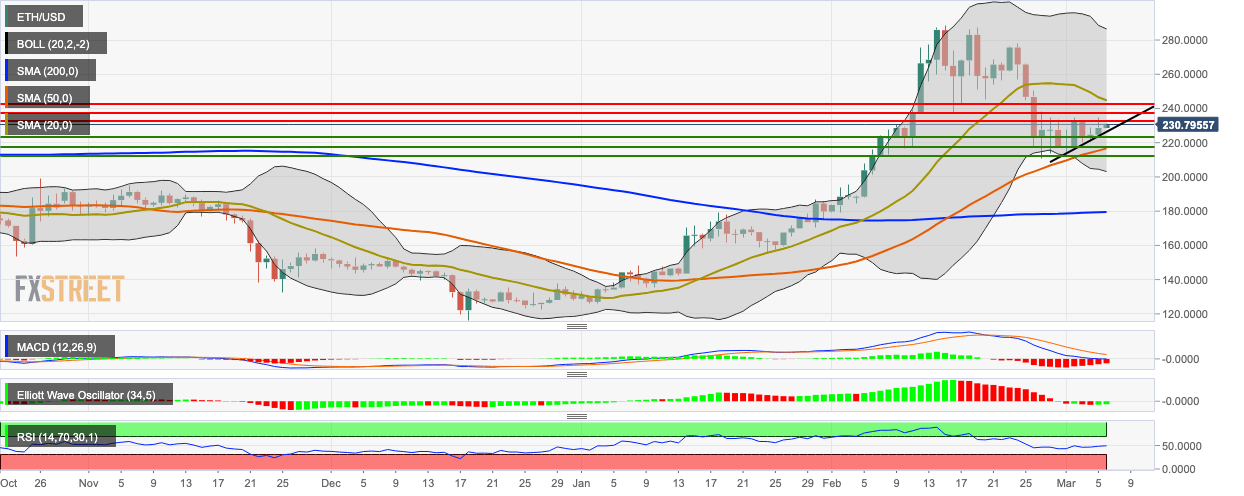
ETH/USD climbed up on the upward trending line and strung together three straight bullish days. So far, ETH/USD has gone up from $228.60 to $230.30, breaking above the $230 psychological level. The price is floating above the SMA 50 and SMA 200 curves and below the SMA 20. The MACD shows decreasing bearish momentum, while the Elliott Oscillator has had three green sessions out of the last five. Finally, the RSI indicator is trending around the neutral territory over the last ten days, showing that the bulls and bears are pretty much canceling each other out.
